Track short-term DFT power spectrum
trk_dft_spectrum.RdComputes a short-term power spectrum via the Fast Fourier Transform using
the libassp C library (Scheffers 2012)
. Produces an
unsmoothed narrow-band spectrum from 0 Hz to the Nyquist rate. Prefer this
function when raw spectral detail is needed; use trk_css_spectrum or
trk_lps_spectrum for smoothed spectral envelopes.
Usage
trk_dft_spectrum(
  listOfFiles,
  beginTime = 0,
  centerTime = FALSE,
  endTime = 0,
  resolution = 40,
  fftLength = 0,
  windowShift = 5,
  window = "BLACKMAN",
  bandwidth = 0,
  toFile = FALSE,
  explicitExt = "dft",
  outputDirectory = NULL,
  assertLossless = NULL,
  logToFile = FALSE,
  keepConverted = FALSE,
  convertOverwrites = FALSE,
  verbose = TRUE
)
Arguments
- listOfFiles
Character vector of audio file paths. Any format supported by av is accepted; non-native inputs are transcoded automatically.
- beginTime
Start time for the extracted portion in seconds. Default: NULL (beginning of signal). Note: uses
beginTime/endTime(seconds) matching DSP function conventions, unlikeread_audio()which usesbegin/end.- centerTime
Numeric or logical. Single-frame analysis time point in seconds; overrides
beginTime,endTime, andwindowShift. DefaultFALSE.- endTime
The end time of the section of the sound files that should be analysed (in seconds). Use 0 for end of file.
- resolution
Numeric. Target FFT frequency resolution in Hz; the FFT length is set to the smallest power-of-2 meeting this target. Default 40.0.
- fftLength
Integer. Explicit FFT length in points; overrides
resolution. Default 0 (useresolution).- windowShift
Numeric. Frame shift in milliseconds; sets output frame rate (
1000 / windowShiftHz). Default 5.0 ms (200 Hz). Must be strictly less than 32 ms (the 512-sample analysis window at 16 kHz). Values other than the training default (5 ms) may slightly reduce accuracy.- window
Character. Analysis window function type. Default
"BLACKMAN". See AsspWindowTypes for supported types.- bandwidth
Numeric. Effective analysis bandwidth in Hz. Default 0 yields the minimum bandwidth determined by the FFT length.
- toFile
Logical. If
TRUE, write SSFF output files and return the count written. IfFALSE, return anAsspDataObj(single file only). DefaultFALSE.- explicitExt
By default, a character "d" will be prepended to the file name suffix when writing the output to file. The user can also specify an explicit extension which will be used instead.
- outputDirectory
The directory where the slice file should be stored. If not defiled (NULL), the sparse slice file will placed in the same folder as the media file.
- assertLossless
Character vector of additional file extensions to treat as losslessly encoded.
- logToFile
Logical. Write processing log to a file in
outputDirectoryrather than the console. DefaultFALSE.- keepConverted
Logical. Retain intermediate transcoded files. Default
FALSE.- convertOverwrites
Logical. Allow transcoding to overwrite existing files. Default
FALSE.- verbose
Logical. Show a progress bar (sequential path) or a progress-aware parallel apply (
pbapply/pbmcapply, if installed).
Value
If toFile = FALSE: an AsspDataObj with track:
DFT[dB]REAL32, dB power, n_frames x (FFT_length/2 + 1) columns. Power spectral amplitude from 0 Hz to the Nyquist rate.
Frame rate: 1000 / windowShift Hz (default 200 Hz).
If toFile = TRUE: integer count of files written, returned invisibly.
Details
The FFT length is determined by resolution unless overridden by
fftLength. bandwidth widens the effective analysis window,
trading spectral resolution for reduced side-lobe leakage.
References
Scheffers M (2012). “Advanced Speech Signal Processor.” https://sourceforge.net/projects/libassp/files/libassp/.
Examples
# get path to audio file
path2wav <- list.files(system.file("samples", "sustained", package = "superassp"),
                       pattern = glob2rx("a1.wav"),
                       full.names = TRUE)

# calculate dft spectrum
res <- trk_dft_spectrum(path2wav, toFile=FALSE)
#> Applying `method(trk_dft_spectrum, class_character)()` to 1 recording

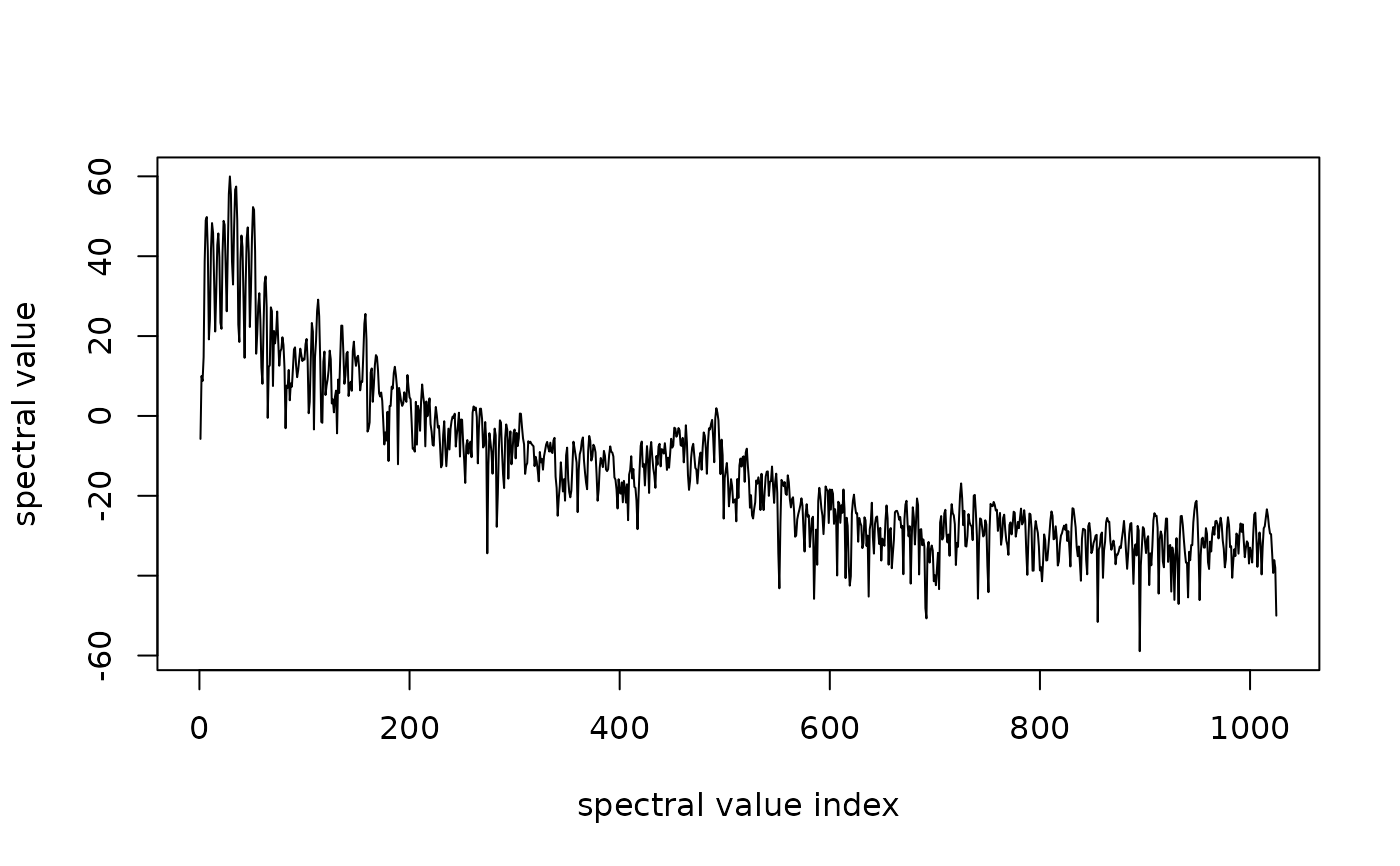
# plot spectral values at midpoint of signal
plot(res[["DFT[dB]"]][dim(res[["DFT[dB]"]])[1]/2,],
     type='l',
     xlab='spectral value index',
     ylab='spectral value')