Migration Guide: From Parselmouth (Python) to pladdrr
Fredrik Nylén
2026-09-14
Source:vignettes/migration-from-parselmouth.Rmd
migration-from-parselmouth.RmdIntroduction
This guide helps Python users familiar with Parselmouth transition to pladdrr for R. Both packages provide access to Praat’s functionality, but pladdrr offers a more direct, object-oriented interface.
Key Differences
Common Operations
Loading Sound Files
Parselmouth:
pladdrr:
library(pladdrr)
#> pladdrr: direct access to Praat's core algorithms from R.
#> See ?pladdrr for an overview, or citation("pladdrr") for citation details.
sound <- Sound$new(system.file("extdata", "test.wav", package = "pladdrr"))Pitch Extraction
Parselmouth:
import parselmouth as pm

sound = pm.Sound("audio.wav")
pitch = pm.praat.call(sound, "To Pitch", 0.01, 75, 600)
mean_f0 = pm.praat.call(pitch, "Get mean", 0, 0, "Hertz")pladdrr:
sound <- Sound$new(system.file("extdata", "test.wav", package = "pladdrr"))
pitch <- sound$to_pitch(time_step = 0.01, pitch_floor = 75, pitch_ceiling = 600)
mean_f0 <- pitch$get_mean(from_time = 0, to_time = 0, unit = "hertz")
Formant Analysis
Parselmouth:
sound = pm.Sound("vowel.wav")
formant = pm.praat.call(sound, "To Formant (burg)", 0.01, 5, 5500, 0.025, 50)
f1 = pm.praat.call(formant, "Get value at time", 1, 0.5, "Hertz", "Linear")
f2 = pm.praat.call(formant, "Get value at time", 2, 0.5, "Hertz", "Linear")
pladdrr:
sound <- Sound$new(system.file("extdata", "test.wav", package = "pladdrr"))
formant <- sound$to_formant_burg(
  time_step = 0.01,
  max_number_of_formants = 5,
  maximum_formant = 5500,
  window_length = 0.025,
  pre_emphasis_from = 50
)
f1 <- formant$get_value_at_time(formant_number = 1, time = 0.5, unit = "hertz")
f2 <- formant$get_value_at_time(formant_number = 2, time = 0.5, unit = "hertz")
Intensity Measurements
Parselmouth:
sound = pm.Sound("audio.wav")
intensity = pm.praat.call(sound, "To Intensity", 100, 0.01, True)
mean_int = pm.praat.call(intensity, "Get mean", 0, 0, "energy")
pladdrr:
sound <- Sound$new(system.file("extdata", "test.wav", package = "pladdrr"))
intensity <- sound$to_intensity(minimum_pitch = 100, time_step = 0.01,
  subtract_mean = TRUE)
mean_int <- intensity$get_mean(from_time = 0, to_time = 0,
  averaging_method = "energy")
Spectral Analysis
Parselmouth:
sound = pm.Sound("audio.wav")
spectrum = pm.praat.call(sound, "To Spectrum", True)
cog = pm.praat.call(spectrum, "Get centre of gravity", 2.0)
pladdrr:
sound <- Sound$new(system.file("extdata", "test.wav", package = "pladdrr"))
spectrum <- sound$to_spectrum(fast = TRUE)
cog <- spectrum$get_centre_of_gravity(power = 2.0)
Batch Processing
Parselmouth Approach
import parselmouth as pm
import os
import pandas as pd

results = []
for filename in os.listdir('.'):
    if filename.endswith('.wav'):
        sound = pm.Sound(filename)
        pitch = pm.praat.call(sound, "To Pitch", 0.01, 75, 600)
        mean_f0 = pm.praat.call(pitch, "Get mean", 0, 0, "Hertz")

        results.append({
            'file': filename,
            'mean_f0': mean_f0
        })

df = pd.DataFrame(results)
df.to_csv('results.csv', index=False)
pladdrr Approach
library(pladdrr)

files <- list.files(system.file("extdata", package = "pladdrr"),
                    pattern = "\\.wav$", full.names = TRUE)

results <- lapply(files, function(filepath) {
  sound <- Sound$new(filepath)
  pitch <- sound$to_pitch(time_step = 0.01, pitch_floor = 75,
    pitch_ceiling = 600)
  mean_f0 <- pitch$get_mean(from_time = 0, to_time = 0, unit = "hertz")

  data.frame(
    file = basename(filepath),
    mean_f0 = mean_f0
  )
})

results_df <- do.call(rbind, results)
write.csv(results_df, file.path(tempdir(), "results.csv"), row.names = FALSE)
Working with Data Frames
Extracting Time Series Data
Parselmouth:
sound = pm.Sound("audio.wav")
pitch = pm.praat.call(sound, "To Pitch", 0.01, 75, 600)

# Extract values manually
times = []
frequencies = []
for i in range(pitch.n_frames):
    time = pitch.xs[i]
    f0 = pm.praat.call(pitch, "Get value at time", time, "Hertz", "Linear")
    times.append(time)
    frequencies.append(f0)

df = pd.DataFrame({'time': times, 'frequency': frequencies})
pladdrr:
sound <- Sound$new(system.file("extdata", "test.wav", package = "pladdrr"))
pitch <- sound$to_pitch(time_step = 0.01, pitch_floor = 75, pitch_ceiling = 600)

# Direct conversion to data frame
pitch_data <- pitch$as_data_frame()
# Returns data.frame with 'time' and 'frequency' columns
Visualization
Parselmouth with matplotlib
import matplotlib.pyplot as plt

sound = pm.Sound("audio.wav")
pitch = pm.praat.call(sound, "To Pitch", 0.01, 75, 600)

# Manual extraction
times = [pitch.xs[i] for i in range(pitch.n_frames)]
f0s = [pm.praat.call(pitch, "Get value at time", t, "Hertz", "Linear")
       for t in times]

plt.figure(figsize=(10, 4))
plt.plot(times, f0s)
plt.xlabel('Time (s)')
plt.ylabel('Frequency (Hz)')
plt.title('Pitch Contour')
plt.show()
pladdrr with ggplot2
library(pladdrr)
library(ggplot2)

sound <- Sound$new(system.file("extdata", "test.wav", package = "pladdrr"))
pitch <- sound$to_pitch(time_step = 0.01, pitch_floor = 75, pitch_ceiling = 600)
pitch_data <- pitch$as_data_frame()

ggplot(pitch_data, aes(x = time, y = frequency)) +
  geom_line() +
  labs(title = "Pitch Contour", x = "Time (s)", y = "Frequency (Hz)") +
  theme_minimal()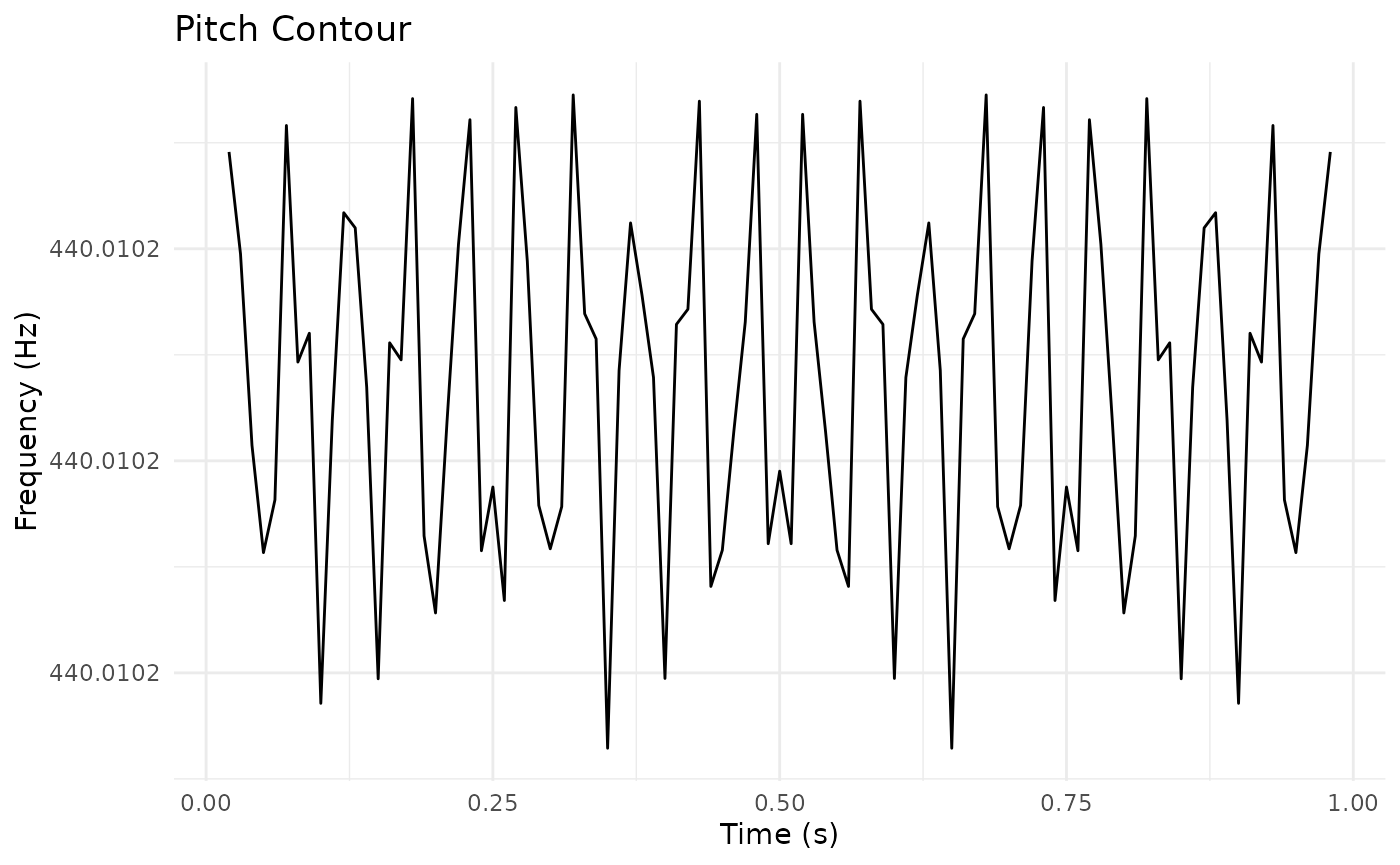
Advanced Workflows
Voice Analysis Pipeline
Parselmouth:
def analyze_voice(filename):
    sound = pm.Sound(filename)

    pitch = pm.praat.call(sound, "To Pitch", 0.01, 75, 600)
    mean_f0 = pm.praat.call(pitch, "Get mean", 0, 0, "Hertz")

    harmonicity = pm.praat.call(sound, "To Harmonicity (cc)", 0.01, 75, 0.1,
      1.0)
    mean_hnr = pm.praat.call(harmonicity, "Get mean", 0, 0)

    pointprocess = pm.praat.call(sound, "To PointProcess (periodic, cc)", 75,
      600)
    jitter = pm.praat.call(pointprocess, "Get jitter (local)", 0, 0, 0.0001,
      0.02, 1.3)

    return {
        'mean_f0': mean_f0,
        'mean_hnr': mean_hnr,
        'jitter': jitter
    }
pladdrr:
analyze_voice <- function(filename) {
  sound <- Sound$new(filename)

  pitch <- sound$to_pitch(time_step = 0.01, pitch_floor = 75,
    pitch_ceiling = 600)
  mean_f0 <- pitch$get_mean(from_time = 0, to_time = 0, unit = "hertz")

  harmonicity <- sound$to_harmonicity_cc(time_step = 0.01, min_pitch = 75,
                                         silence_threshold = 0.1, periods_per_window = 1.0)
  mean_hnr <- harmonicity$get_mean(from_time = 0, to_time = 0)

  pointprocess <- sound$to_pointprocess_periodic_cc(pitch_floor = 75,
    pitch_ceiling = 600)
  jitter <- pointprocess$get_jitter_local(from_time = 0, to_time = 0,
                                          period_floor = 0.0001, period_ceiling = 0.02,
                                          max_period_factor = 1.3)

  list(
    mean_f0 = mean_f0,
    mean_hnr = mean_hnr,
    jitter = jitter
  )
}
Integration with Data Science Tools
pladdrr + tidyverse
# Requires the dplyr, purrr, and tidyr packages (not pladdrr dependencies;
# install separately if needed)
library(pladdrr)
library(dplyr)
#>
#> Attaching package: 'dplyr'
#> The following objects are masked from 'package:stats':
#>
#>     filter, lag
#> The following objects are masked from 'package:base':
#>
#>     intersect, setdiff, setequal, union
library(purrr)
library(tidyr)

wav <- system.file("extdata", "test.wav", package = "pladdrr")
results <- tibble(
  file = c(wav, wav, wav),
  speaker = c("A", "B", "C")
) %>%
  mutate(
    analysis = map(file, analyze_voice)
  ) %>%
  unnest_wider(analysis)
#> Warning: There were 3 warnings in `mutate()`.
#> The first warning was:
#> ℹ In argument: `analysis = map(file, analyze_voice)`.`.
#> Caused by warning:
#> ! time_step, max_period_factor, and max_amplitude_factor are not used by Sound_to_PointProcess_periodic_cc(). Only pitch_floor and pitch_ceiling are used.
#> ℹ Run `dplyr::last_dplyr_warnings()` to see the 2 remaining warnings.s.
Advantages of pladdrr
- No Python Dependency: Pure R package
- Better IDE Support: Full autocomplete and documentation
- Type Safety: Named parameters prevent errors
- R Ecosystem: Integration with tidyverse, ggplot2, etc.
- Self-Documenting: Method names describe functionality
When to Use Each
Common Issues and Solutions
Issue 1: String-based commands
Problem: In Parselmouth, you must remember exact command strings.
Solution: pladdrr provides method autocomplete in RStudio/VS Code.
Getting Help
- Package documentation:
help(package = "pladdrr") - Vignettes:
vignette(package = "pladdrr") - Maintainer: fredrik.nylen@umu.se
- Compare with Praat manual: https://www.fon.hum.uva.nl/praat/manual/
Conclusion
Both Parselmouth and pladdrr provide access to Praat’s functionality.
pladdrr differs in offering a direct, object-oriented (R6) interface
with named parameters, instead of a string-based
praat.call() dispatcher, and integrates with the R
ecosystem (tidyverse, ggplot2).
The transition from Parselmouth to pladdrr mainly involves replacing `praat.call(
)` calls with direct method calls, using the naming conventions shown above.