TextGrid Workflows with pladdrr
pladdrr Package Authors
2026-09-14
Source:vignettes/textgrid-workflows.Rmd
textgrid-workflows.RmdOverview
TextGrids are Praat’s standard format for time-aligned speech annotation. This vignette demonstrates:
- Creating TextGrids from scratch or from existing files
- Querying annotations (intervals, points, boundaries)
- Modifying annotations (insert, delete, relabel)
- Tier management (add, remove, rename)
- Large-scale corpus processing with performance optimization
- Data export to R data frames and CSV
- Integration with forced alignment tools
TextGrids are used throughout phonetic research for time-aligned annotation of speech data.
Background
TextGrid Structure
A TextGrid contains tiers of two types:
-
Interval tiers: Contiguous segments with start/end
times and labels
- Use cases: words, phones, syllables, utterances, speaker turns
- Each interval has: start time, end time, text label
-
Point tiers: Discrete time points with labels
- Use cases: landmarks (e.g., burst release, vowel onset), events, boundaries
- Each point has: time, text label
Common Workflows
Manual annotation: - Create TextGrid in Praat - Manually segment and label - Load in R for analysis
Forced alignment: - Use tools like Montreal Forced Aligner, WebMAUS, or Gentle - Generates word- and phone-level TextGrids automatically - Load in R for quality control and analysis
Hybrid approach: - Automatic alignment for initial segmentation - Manual correction in Praat - Batch analysis in R
Part 1: Creating TextGrids
Creating from Scratch
library(pladdrr)
#> pladdrr: direct access to Praat's core algorithms from R.
#> See ?pladdrr for an overview, or citation("pladdrr") for citation details.

# Create a TextGrid with multiple tiers.
# tier_names lists ALL tiers to create; point_tiers is the subset of those
# names that should be PointTiers instead of IntervalTiers (a tier must
# appear in tier_names before it can be designated a point tier).
tg <- TextGrid$create(
  tmin = 0,
  tmax = 10,
  tier_names = "utterances words phones events",
  point_tiers = "events"
)

cat("Created TextGrid with", tg$get_number_of_tiers(), "tiers\n")
#> Created TextGrid with 4 tiers
cat("Duration:", tg$get_total_duration(), "seconds\n")
#> Duration: 10 seconds
Adding Interval Boundaries
# Add word boundaries to the "words" tier (tier 2)
word_tier <- 2

# Insert boundaries at specific times
tg$insert_boundary(word_tier, time = 1.0)
tg$insert_boundary(word_tier, time = 2.5)
tg$insert_boundary(word_tier, time = 4.0)
tg$insert_boundary(word_tier, time = 6.5)
tg$insert_boundary(word_tier, time = 8.0)

# Label the created intervals
tg$set_interval_text(word_tier, 1, "")
tg$set_interval_text(word_tier, 2, "hello")
tg$set_interval_text(word_tier, 3, "world")
tg$set_interval_text(word_tier, 4, "this")
tg$set_interval_text(word_tier, 5, "is")
tg$set_interval_text(word_tier, 6, "test")

cat("Added", tg$get_number_of_intervals(word_tier), "intervals to words tier\n")
#> Added 6 intervals to words tier
Adding Point Annotations
# Add events to the point tier (tier 4)
events_tier <- 4

tg$insert_point(events_tier, time = 0.5, mark = "recording_start")
tg$insert_point(events_tier, time = 5.0, mark = "sentence_boundary")
tg$insert_point(events_tier, time = 9.5, mark = "recording_end")

cat("Added", tg$get_number_of_points(events_tier), "points to events tier\n")
#> Added 3 points to events tier
Loading from File
# Load an existing TextGrid file:
# tg_from_file <- TextGrid$new("path/to/annotation.TextGrid")

# From package example data (kept as a separate object here; the rest of
# this vignette continues to use the `tg` built in Part 1)
tg_file <- system.file("extdata", "benchmarkdata1min.TextGrid",
  package = "pladdrr")
tg_from_file <- TextGrid$new(tg_file)
Part 2: Querying TextGrids
Tier Information
# Get tier names and types
tier_names <- tg$get_tier_names()
n_tiers <- tg$get_number_of_tiers()

for (i in 1:n_tiers) {
  is_interval <- tg$tier_is_interval_tier(i)
  tier_type <- if (is_interval) "IntervalTier" else "PointTier"

  n_items <- if (is_interval) {
    tg$get_number_of_intervals(i)
  } else {
    tg$get_number_of_points(i)
  }

  cat(sprintf("Tier %d: %s (%s) - %d items\n",
              i, tier_names[i], tier_type, n_items))
}
#> Tier 1: utterances (IntervalTier) - 1 items
#> Tier 2: words (IntervalTier) - 6 items
#> Tier 3: phones (IntervalTier) - 1 items
#> Tier 4: events (PointTier) - 3 items
Extracting Interval Information
# Get all intervals from a specific tier
tier_idx <- 2  # words tier
n_intervals <- tg$get_number_of_intervals(tier_idx)

# Create data frame with interval information
intervals_df <- data.frame(
  index = 1:n_intervals,
  start = numeric(n_intervals),
  end = numeric(n_intervals),
  duration = numeric(n_intervals),
  label = character(n_intervals),
  stringsAsFactors = FALSE
)

for (i in 1:n_intervals) {
  intervals_df$start[i] <- tg$get_interval_start_time(tier_idx, i)
  intervals_df$end[i] <- tg$get_interval_end_time(tier_idx, i)
  intervals_df$duration[i] <- intervals_df$end[i] - intervals_df$start[i]
  intervals_df$label[i] <- tg$get_interval_text(tier_idx, i)
}

print(intervals_df)
#>   index start  end duration label
#> 1     1   0.0  1.0      1.0
#> 2     2   1.0  2.5      1.5 hello
#> 3     3   2.5  4.0      1.5 world
#> 4     4   4.0  6.5      2.5  this
#> 5     5   6.5  8.0      1.5    is
#> 6     6   8.0 10.0      2.0  test
Time-Based Queries
# Find interval at specific time
query_time <- 3.0
interval_idx <- tg$get_interval_at_time(tier_idx, query_time)

if (!is.na(interval_idx)) {
  label <- tg$get_interval_text(tier_idx, interval_idx)
  start <- tg$get_interval_start_time(tier_idx, interval_idx)
  end <- tg$get_interval_end_time(tier_idx, interval_idx)

  cat(sprintf("At time %.2f s: '%s' [%.2f - %.2f]\n",
              query_time, label, start, end))
}
#> At time 3.00 s: 'world' [2.50 - 4.00]

# Find interval by label
target_label <- "world"
for (i in 1:n_intervals) {
  if (tg$get_interval_text(tier_idx, i) == target_label) {
    cat(sprintf("Found '%s' at interval %d\n", target_label, i))
    break
  }
}
#> Found 'world' at interval 3
Point Tier Queries
# Get all points from events tier
points_tier <- 4
n_points <- tg$get_number_of_points(points_tier)

for (i in seq_len(n_points)) {
  time <- tg$get_point_time(points_tier, i)
  mark <- tg$get_point_text(points_tier, i)
  cat(sprintf("Point %d: %.3f s - '%s'\n", i, time, mark))
}
#> Point 1: 0.500 s - 'recording_start'
#> Point 2: 5.000 s - 'sentence_boundary'
#> Point 3: 9.500 s - 'recording_end'
Part 3: Modifying TextGrids
Inserting and Removing Boundaries
# Insert a new boundary in the middle of an interval
tier_idx <- 2
tg$insert_boundary(tier_idx, time = 3.25)

# This splits an existing interval into two
# Label the newly created intervals
new_interval <- tg$get_interval_at_time(tier_idx, 3.26)
tg$set_interval_text(tier_idx, new_interval, "new")

cat("Inserted boundary, now have",
    tg$get_number_of_intervals(tier_idx), "intervals\n")
#> Inserted boundary, now have 7 intervals

# Remove a boundary (merges adjacent intervals)
# tg$remove_boundary(tier_idx, time = 3.25)
Relabeling
# Change interval label
tier_idx <- 2
interval_idx <- 3
tg$set_interval_text(tier_idx, interval_idx, "WORLD")

# Change point label
points_tier <- 4
tg$set_point_text(points_tier, 2, "BOUNDARY")

cat("Updated labels\n")
#> Updated labels
Adding and Removing Tiers
# Add a new interval tier
tg$add_interval_tier(name = "syllables")
cat("Added 'syllables' tier, now have", tg$get_number_of_tiers(), "tiers\n")
#> Added 'syllables' tier, now have 5 tiers

# Add a new point tier
tg$add_point_tier(name = "landmarks")
cat("Added 'landmarks' tier, now have", tg$get_number_of_tiers(), "tiers\n")
#> Added 'landmarks' tier, now have 6 tiers

# Remove a tier (use with caution!)
# tg$remove_tier(tier = 6)

# Rename a tier
tg$set_tier_name(tier = 3, new_name = "segments")
cat("Renamed tier 3 to 'segments'\n")
#> Renamed tier 3 to 'segments'Part 4: Large-Scale Corpus Analysis
Loading Large TextGrids
# Example with 1min file (large files removed to reduce package size)
tg_file <- system.file("extdata", "benchmarkdata1min.TextGrid",
  package = "pladdrr")

# Measure load time
start_time <- Sys.time()
tg <- TextGrid$new(tg_file)
load_time <- as.numeric(difftime(Sys.time(), start_time, units = "secs"))

cat(sprintf("Loaded in %.3f seconds\n", load_time))
#> Loaded in 0.008 seconds
cat(sprintf("Duration: %.2f minutes\n", tg$get_total_duration() / 60))
#> Duration: 1.00 minutes
cat(sprintf("File size: %.1f MB\n", file.size(tg_file) / 1024^2))
#> File size: 1.2 MB
Efficient Data Extraction
Extract all data at once using the built-in conversion:
# Convert entire TextGrid to data frame
tg_df <- tg$as_data_frame()

# Or specific tiers only, by name
tier_names_subset <- tg$get_tier_names()[1:2]  # First two tiers
tg_df <- tg$as_data_frame(tiers = tier_names_subset)

# Now use standard R operations
summary(tg_df)
#>      tier_name       tier_type    item_number    start_time       end_time
#>  Length   :802   Length   :802   Min.   :  1   Min.   : 0.00   Min.   : 0.105
#>  N.unique :  2   N.unique :  1   1st Qu.:101   1st Qu.:14.79   1st Qu.:14.976
#>  N.blank  :  0   N.blank  :  0   Median :201   Median :29.83   Median :29.999
#>  Min.nchar:  8   Min.nchar:  8   Mean   :201   Mean   :29.97   Mean   :30.118
#>  Max.nchar:  8   Max.nchar:  8   3rd Qu.:301   3rd Qu.:44.95   3rd Qu.:45.071
#>                                  Max.   :402   Max.   :59.98   Max.   :60.000
#>        label
#>  Length   :802
#>  N.unique :793
#>  N.blank  :  0
#>  Min.nchar:  1
#>  Max.nchar:290
#>
table(tg_df$tier_name)
#>
#> Tier_1_1 Tier_1_2
#>      400      402
Sampling Large Datasets
For extremely large TextGrids (e.g., multi-hour recordings):
# Sample intervals instead of processing all
tier_idx <- 1
n_intervals <- tg$get_number_of_intervals(tier_idx)

# Random sample of 1000 intervals (or all if fewer)
sample_size <- min(1000, n_intervals)
sampled_indices <- sample(1:n_intervals, sample_size)

# Process only sampled intervals
sampled_data <- data.frame()
for (i in sampled_indices) {
  # Extract features...
  # sampled_data <- rbind(sampled_data, ...)
}
Batch Processing Multiple Files
Process an entire corpus of TextGrids:
# List all TextGrid files in a corpus directory:
# textgrid_dir <- "path/to/corpus/"
# tg_files <- list.files(textgrid_dir, pattern = "\\.TextGrid$", full.names =
#  TRUE)

# For this example, use the package's own sample files as a toy corpus
tg_files <- c(
  system.file("extdata", "test.TextGrid", package = "pladdrr"),
  system.file("extdata", "benchmarkdata1min.TextGrid", package = "pladdrr")
)

# Initialize results
all_data <- data.frame()

# Process each file
for (tg_file in tg_files) {
  cat("Processing:", basename(tg_file), "\n")

  tg <- TextGrid$new(tg_file)

  # Extract features (example: interval durations)
  tier_idx <- 1
  n_intervals <- tg$get_number_of_intervals(tier_idx)

  for (i in 1:n_intervals) {
    start <- tg$get_interval_start_time(tier_idx, i)
    end <- tg$get_interval_end_time(tier_idx, i)
    label <- tg$get_interval_text(tier_idx, i)

    all_data <- rbind(all_data, data.frame(
      file = basename(tg_file),
      interval = i,
      label = label,
      duration = end - start
    ))
  }
}
#> Processing: test.TextGrid
#> Processing: benchmarkdata1min.TextGrid

# Analyze corpus-wide
summary(all_data$duration)
#>    Min. 1st Qu.  Median    Mean 3rd Qu.    Max.
#>  0.0210  0.1268  0.1515  0.1559  0.1740  1.0000
table(all_data$file)
#>
#> benchmarkdata1min.TextGrid              test.TextGrid
#>                        400                          4
Part 5: Integration with Forced Alignment
Montreal Forced Aligner (MFA) Output
MFA produces TextGrids with word and phone tiers:
# Load MFA output:
# mfa_tg <- TextGrid$new("speaker01_aligned.TextGrid")

# The package's sample TextGrid has the same word/phone tier layout MFA
# produces, so it stands in for an MFA output file here.
mfa_tg <- TextGrid$new(
  system.file("extdata", "test.TextGrid", package = "pladdrr"))

# Typical MFA structure:
# Tier 1: words
# Tier 2: phones

# Extract phone durations
phone_tier <- "phones"
n_phones <- mfa_tg$get_number_of_intervals(phone_tier)

phone_durations <- data.frame(
  phone = character(n_phones),
  duration = numeric(n_phones),
  stringsAsFactors = FALSE
)

for (i in 1:n_phones) {
  phone_durations$phone[i] <- mfa_tg$get_interval_text(phone_tier, i)
  start <- mfa_tg$get_interval_start_time(phone_tier, i)
  end <- mfa_tg$get_interval_end_time(phone_tier, i)
  phone_durations$duration[i] <- end - start
}

# IPA symbols (e.g. the open-mid vowels MFA/Praat produce) are multi-byte
# UTF-8. Some build environments render vignettes under a non-UTF-8 locale,
# where R can't line-wrap multi-byte text for printing and errors out —
# so escape non-ASCII phone labels to their Unicode code points for display.
phone_durations$phone <- vapply(phone_durations$phone, function(s) {
  codepoints <- utf8ToInt(enc2utf8(s))
  if (all(codepoints < 128L)) return(s)
  paste(sprintf("\\u%04x", codepoints), collapse = "")
}, character(1))

# Analyze by phone class
aggregate(duration ~ phone, data = phone_durations, FUN = mean)
#>     phone duration
#> 1              0.5
#> 2 \\u0254      0.5
#> 3 \\u025b      0.4
#> 4       h      0.3
#> 5       l      0.3
#> 6       w      0.5
Quality Control for Forced Alignment
Check alignment quality:
# Flag suspiciously short or long intervals
min_duration <- 0.020  # 20 ms
max_duration <- 0.500  # 500 ms

short_intervals <- phone_durations$duration < min_duration
long_intervals <- phone_durations$duration > max_duration

cat("Intervals needing review:\n")
#> Intervals needing review:
cat("  Too short:", sum(short_intervals), "\n")
#>   Too short: 0
cat("  Too long:", sum(long_intervals), "\n")
#>   Too long: 0

# Export for manual correction
flagged <- phone_durations[short_intervals | long_intervals, ]
write.csv(flagged, file.path(tempdir(), "alignment_review.csv"),
  row.names = FALSE)
Part 6: Data Export and Visualization
Export to CSV
# Export interval data
write.csv(intervals_df, file.path(tempdir(), "textgrid_intervals.csv"),
  row.names = FALSE)

# Export with additional metadata
intervals_df$file <- "recording01.wav"
intervals_df$speaker <- "S01"
intervals_df$tier <- "words"

write.csv(intervals_df, file.path(tempdir(), "corpus_annotations.csv"),
row.names = FALSE)Visualization
pladdrr defines autoplot()/autolayer() S3
methods for TextGrid objects. autoplot()
renders all tiers as a standalone ggplot; autolayer()
returns a layer (interval boxes and labels, or point markers) that can
be added to an existing plot, e.g. on top of a Sound’s waveform.
library(ggplot2)

tg <- TextGrid$new(system.file("extdata", "test.TextGrid", package = "pladdrr"))

# All tiers in one ggplot
autoplot(tg)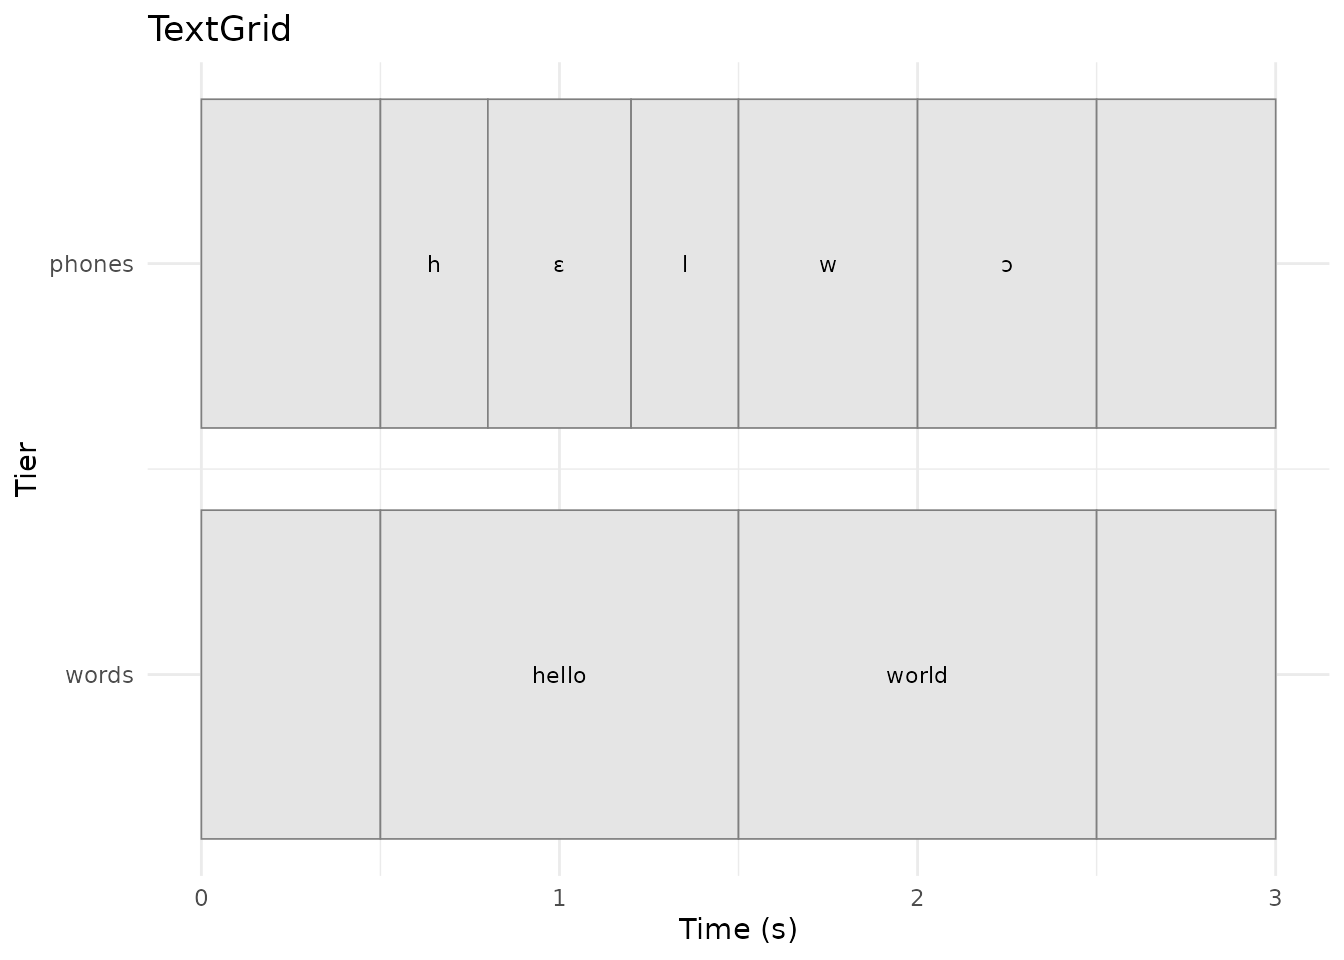
# One tier as a layer on top of a waveform
sound <- Sound$new(system.file("extdata", "test.wav", package = "pladdrr"))
autoplot(sound) + autolayer(tg, tier = "words")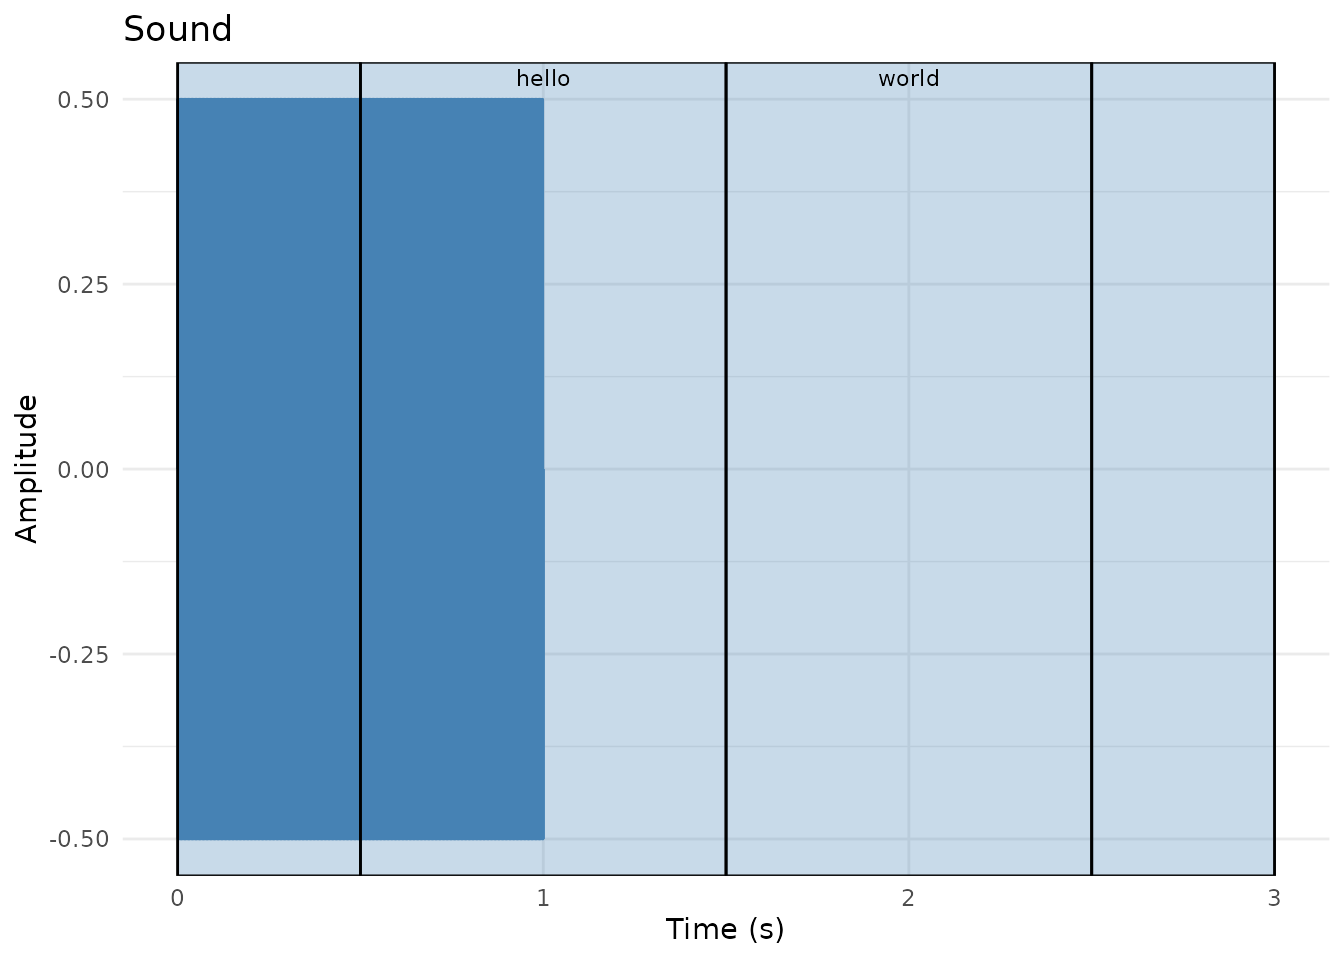
For further examples (interval duration distributions, label
frequency plots, multi-tier layouts), see
vignette("visualization").
Best Practices
1. Consistent Labeling
Use standardized labels for reproducibility:
tg <- TextGrid$new(system.file("extdata", "test.TextGrid", package = "pladdrr"))
tier_idx <- "phones"
n_intervals <- tg$get_number_of_intervals(tier_idx)

# Define label conventions
vowels <- c("i", "e", "a", "o", "u")
consonants <- c("p", "t", "k", "b", "d", "g", "m", "n")

# Validate labels
for (i in 1:n_intervals) {
  label <- tg$get_interval_text(tier_idx, i)
  if (!(label %in% c(vowels, consonants, ""))) {
    cat("Non-standard label at interval", i, ":", label, "\n")
  }
}
#> Non-standard label at interval 2 : h
#> Non-standard label at interval 3 : ɛ
#> Non-standard label at interval 4 : l
#> Non-standard label at interval 5 : w
#> Non-standard label at interval 6 : ɔ4. Backup Before Editing
Always save a copy before modifying:
# Save original
original_tg <- tg  # R6 objects are passed by reference, so duplicate:
# (In practice, save to disk before editing)

# Edit safely
tg$insert_boundary(tier_idx, time = 0.9)

# Revert if needed
# tg <- TextGrid$new("original_file.TextGrid")
Real-World Applications
1. Prosodic Analysis
Extract F0 contours aligned to intonational phrases:
# Assume the "words" tier has intonational phrase boundaries
sound <- Sound$new(system.file("extdata", "test.wav", package = "pladdrr"))
pitch <- sound$to_pitch()
tg <- TextGrid$new(system.file("extdata", "test.TextGrid", package = "pladdrr"))

phrase_tier <- "words"
n_phrases <- tg$get_number_of_intervals(phrase_tier)

for (i in 1:n_phrases) {
  start <- tg$get_interval_start_time(phrase_tier, i)
  end <- tg$get_interval_end_time(phrase_tier, i)

  f0_mean <- pitch$get_mean(from_time = start, to_time = end, unit = "hertz")
  cat(sprintf("Phrase %d: Mean F0 = %.1f Hz\n", i, f0_mean))
}
#> Phrase 1: Mean F0 = 440.0 Hz
#> Phrase 2: Mean F0 = 440.0 Hz
#> Phrase 3: Mean F0 = NaN Hz
#> Phrase 4: Mean F0 = NaN Hz
2. Voice Onset Time (VOT) Measurement
Measure time between burst and voicing onset:
# Assume a point tier with "burst" and "voicing_onset" marks
tg <- TextGrid$create(tmin = 0, tmax = 2, tier_names = "events",
  point_tiers = "events")
tg$insert_point("events", time = 0.10, mark = "burst")
tg$insert_point("events", time = 0.15, mark = "voicing_onset")
tg$insert_point("events", time = 0.50, mark = "burst")
tg$insert_point("events", time = 0.58, mark = "voicing_onset")

events_tier <- "events"
n_points <- tg$get_number_of_points(events_tier)
burst_times <- NULL
voicing_times <- NULL

for (i in seq_len(n_points)) {
  mark <- tg$get_point_text(events_tier, i)
  time <- tg$get_point_time(events_tier, i)

  if (mark == "burst") burst_times <- c(burst_times, time)
  if (mark == "voicing_onset") voicing_times <- c(voicing_times, time)
}

# Calculate VOTs (assumes paired marks)
vots <- voicing_times - burst_times
cat("Mean VOT:", mean(vots) * 1000, "ms\n")
#> Mean VOT: 65 ms
3. Automated Tier Creation
Generate derived tiers programmatically:
# Create syllable tier from phone tier
tg <- TextGrid$new(system.file("extdata", "test.TextGrid", package = "pladdrr"))
phone_tier <- "phones"
tg$add_interval_tier("syllables")
syllable_tier <- tg$get_number_of_tiers()

# Define syllable nuclei (vowels)
vowels <- c("i", "e", "a", "o", "u")

# Group phones into syllables (simplified logic)
current_syllable_start <- 0
for (i in 1:tg$get_number_of_intervals(phone_tier)) {
  phone <- tg$get_interval_text(phone_tier, i)

  if (phone %in% vowels) {
    # Found vowel - mark syllable boundary
    end_time <- tg$get_interval_end_time(phone_tier, i)
    tg$insert_boundary(syllable_tier, time = end_time)
  }
}
Summary
pladdrr’s TextGrid support covers:
- Creation, from scratch or from a file
- Querying (intervals, points, time-based lookup)
- Editing (insert, delete, relabel, manage tiers)
- Corpus-scale processing (batch loading, sampling,
as_data_frame()export) - Loading forced-alignment output (e.g. Montreal Forced Aligner)
- Export to CSV/data frame for downstream analysis
For related workflows, see:
-
vignette("integrated-phonetic-analysis")- TextGrid + acoustic analysis -
vignette("vowel-space-analysis")- Formant extraction pipelines -
inst/examples/06_textgrid_analysis.R- Basic operations -
inst/examples/08_textgrid_corpus_analysis.R- Large-scale processing
References
- Boersma, P., & Weenink, D. ( 2023). Praat: doing phonetics by computer. https://praat.org/
- McAuliffe, M., Socolof, M., Mihuc, S., Wagner, M., & Sonderegger, M. ( 2017). Montreal Forced Aligner: Trainable text-speech alignment using Kaldi. Interspeech 2017.
- Kisler, T., Reichel, U., & Schiel, F. ( 2017). Multilingual processing of speech via web services. Computer Speech & Language, 45, 326-347.