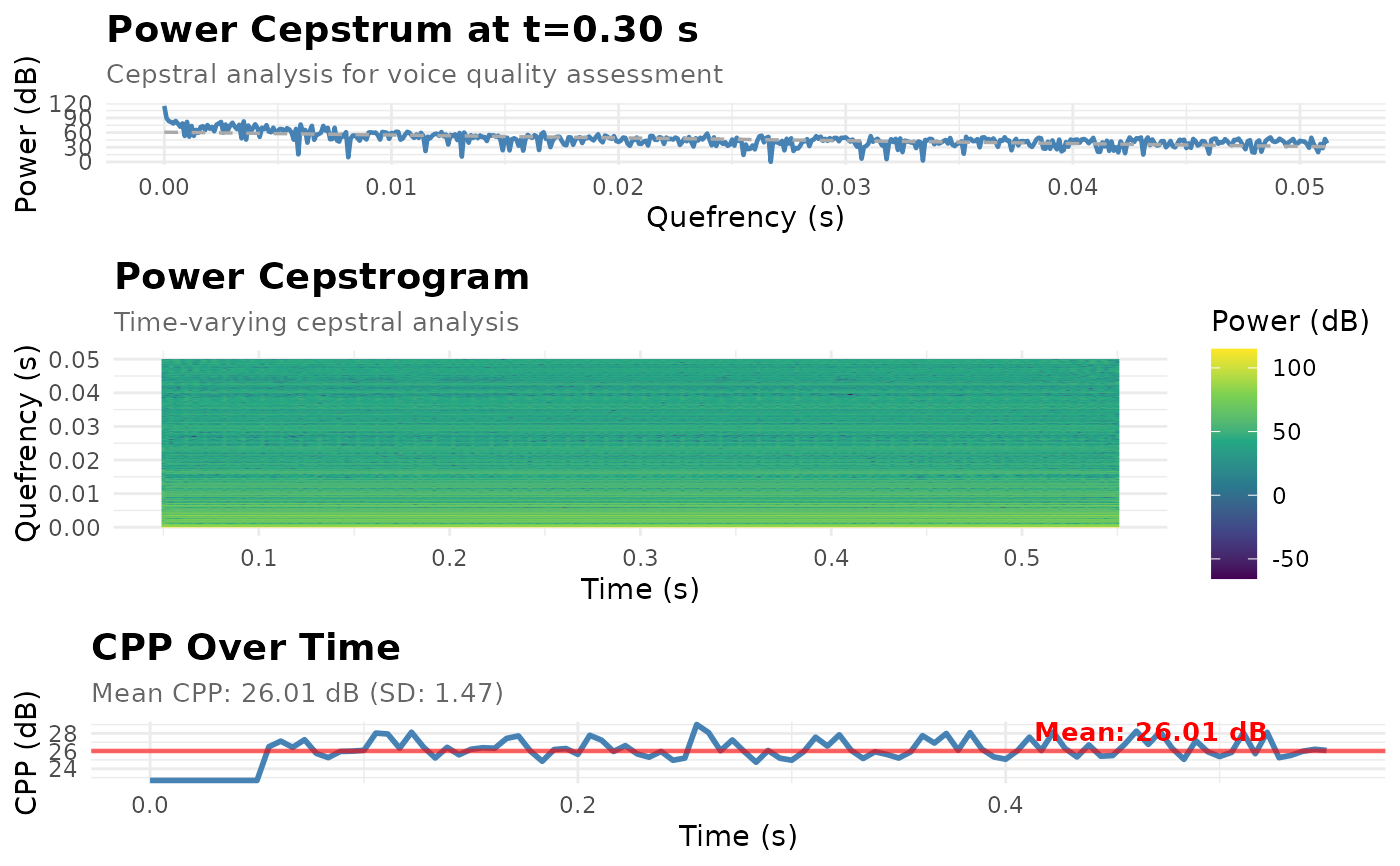
Creates a multi-panel diagnostic plot combining power cepstrum, cepstrogram, and CPP time series for comprehensive analysis.
Usage
create_cepstrum_report(
  cepstrogram,
  time_slice = NULL,
  save_path = NULL,
  format = c("png", "pdf", "svg"),
  dpi = 300
)Examples
if (requireNamespace("gridExtra", quietly = TRUE)) {
sound <- Sound$create_tone(frequency = 150, duration = 0.6, sampling_rate =
 16000)
  cepstrogram <- sound$to_powercepstrogram(pitch_floor = 60)

  # Create comprehensive report at t = 0.3s (mid-signal)
  create_cepstrum_report(cepstrogram, time_slice = 0.3)
}
#> Warning: Could not compute peak: unused arguments (qmin = 0.001, qmax = 0)