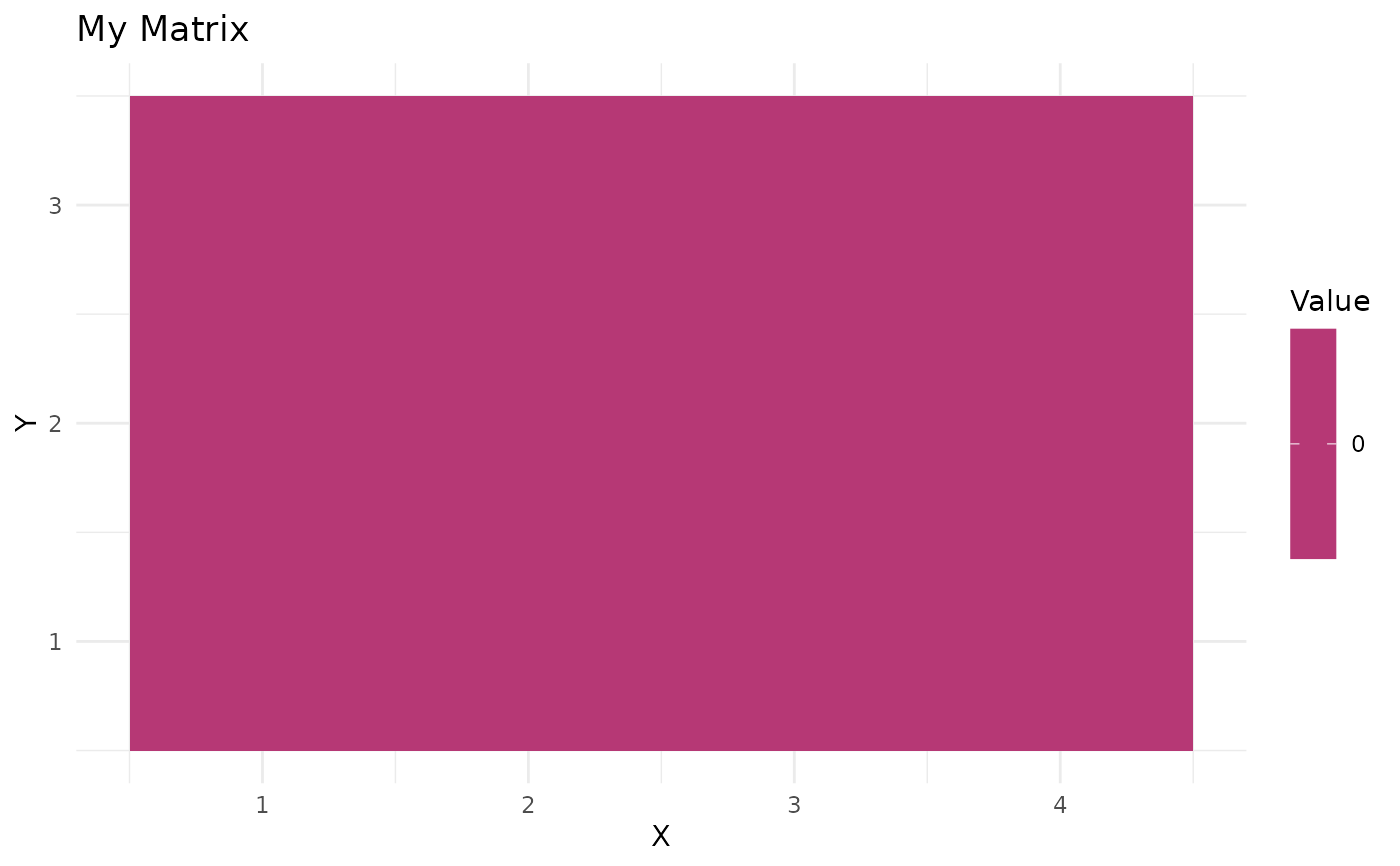
Creates a heatmap visualization of a Matrix object. Supports any Matrix-derived objects including generic matrices, spectrograms, etc.
Usage
# S3 method for class 'Matrix'
plot(
  x,
  from_x = NULL,
  to_x = NULL,
  from_y = NULL,
  to_y = NULL,
  garnish = TRUE,
  title = "Matrix",
  x_label = "X",
  y_label = "Y",
  color_scale = "viridis",
  ...
)
Arguments
- x
Matrix object
- from_x
Start value for x-axis (NULL = from beginning)
- to_x
End value for x-axis (NULL = to end)
- from_y
Start value for y-axis (NULL = from beginning)
- to_y
End value for y-axis (NULL = to end)
- garnish
Logical. Add axis labels and title (default: TRUE)
- title
Character. Plot title (default: "Matrix")
- x_label
Character. X-axis label (default: "X")
- y_label
Character. Y-axis label (default: "Y")
- color_scale
Character. Color scale to use: "viridis", "magma", "plasma", "inferno", "cividis", or "greyscale" (default: "viridis")
- ...
Additional arguments passed to the underlying function or ignored.
Examples
m <- matrix_create_simple(3, 4)
# Basic heatmap
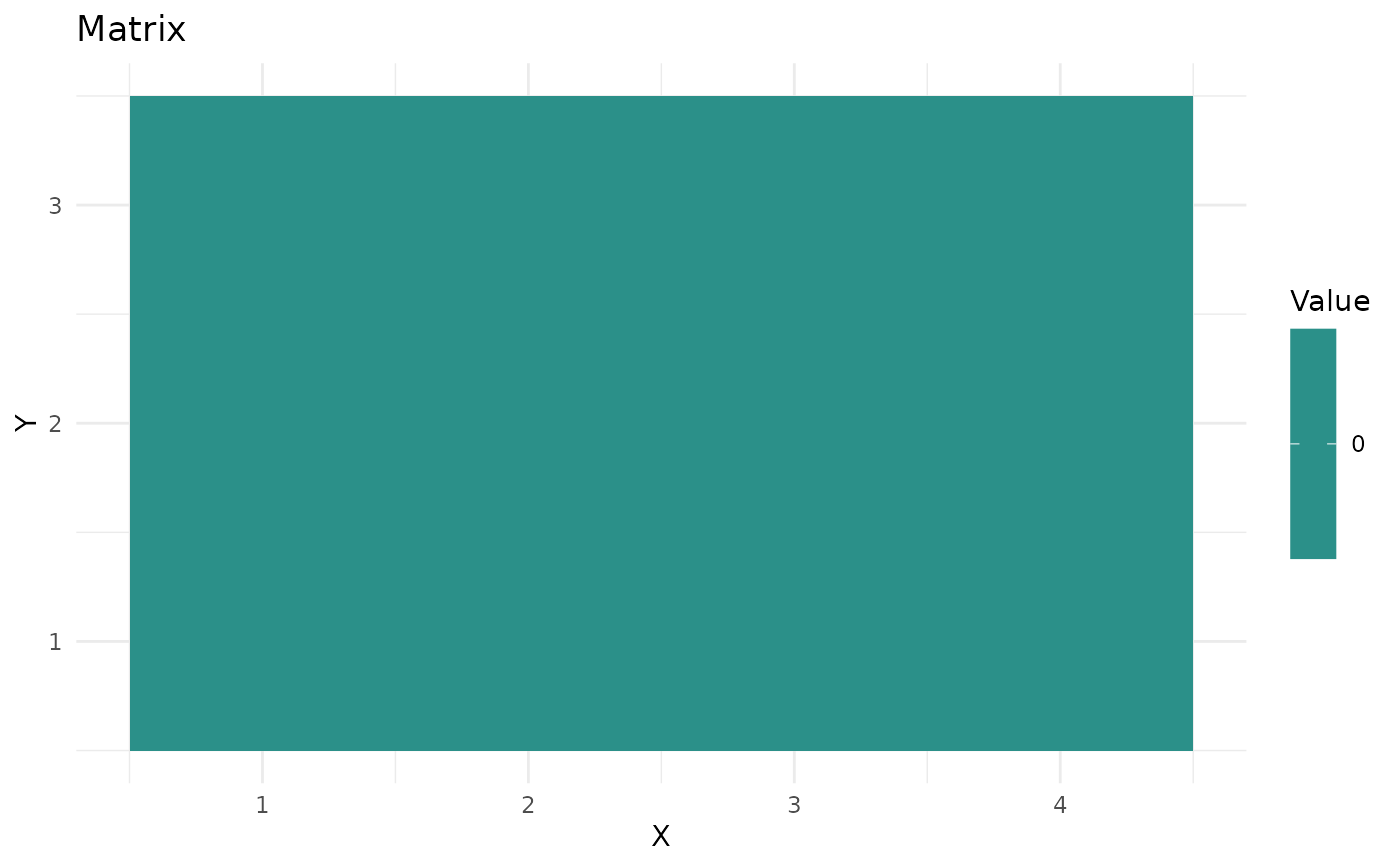
plot(m)
 # Custom color scale
plot(m, color_scale = "magma", title = "My Matrix")
# Custom color scale
plot(m, color_scale = "magma", title = "My Matrix")