Creates a visualization of PointProcess events (e.g., glottal pulses).
Usage
# S3 method for class 'PointProcess'
plot(
  x,
  from_time = NULL,
  to_time = NULL,
  garnish = TRUE,
  title = "PointProcess",
  color = "black",
  ...
)
Arguments
- x
PointProcess object
- from_time
Start time in seconds (NULL = from beginning)
- to_time
End time in seconds (NULL = to end)
- garnish
Logical. Add axis labels and title (default: TRUE)
- title
Character. Plot title (default: "PointProcess")
- color
Character. Line color (default: "black")
- ...
Additional arguments passed to the underlying function or ignored.
Examples
sound <- Sound$create_tone(frequency = 220, duration = 1.0)
pulses <- sound$to_pointprocess_periodic_cc()
#> Warning: time_step, max_period_factor, and max_amplitude_factor are not used by Sound_to_PointProcess_periodic_cc(). Only pitch_floor and pitch_ceiling are used.
# Basic plot
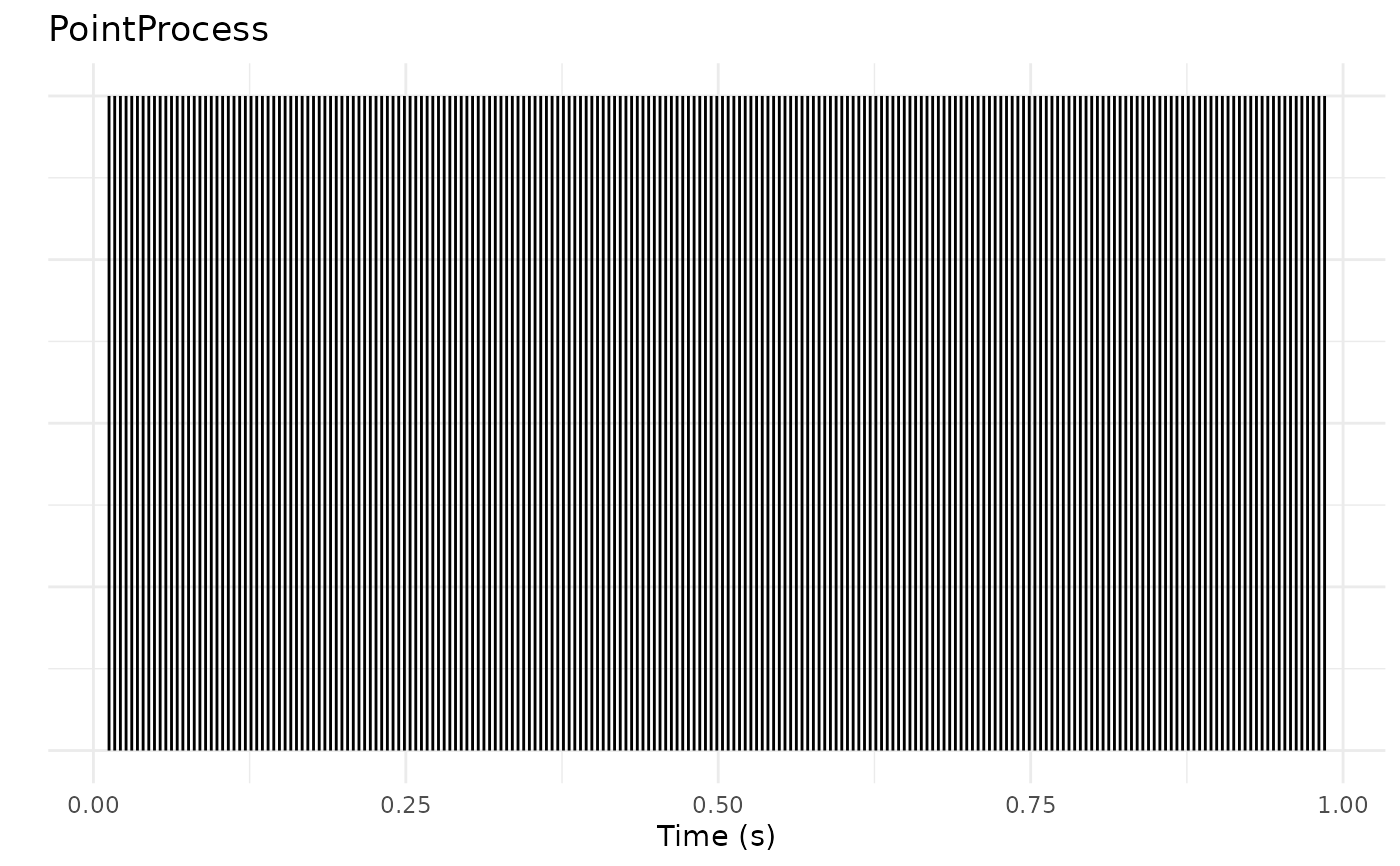
plot(pulses)
 # Time range
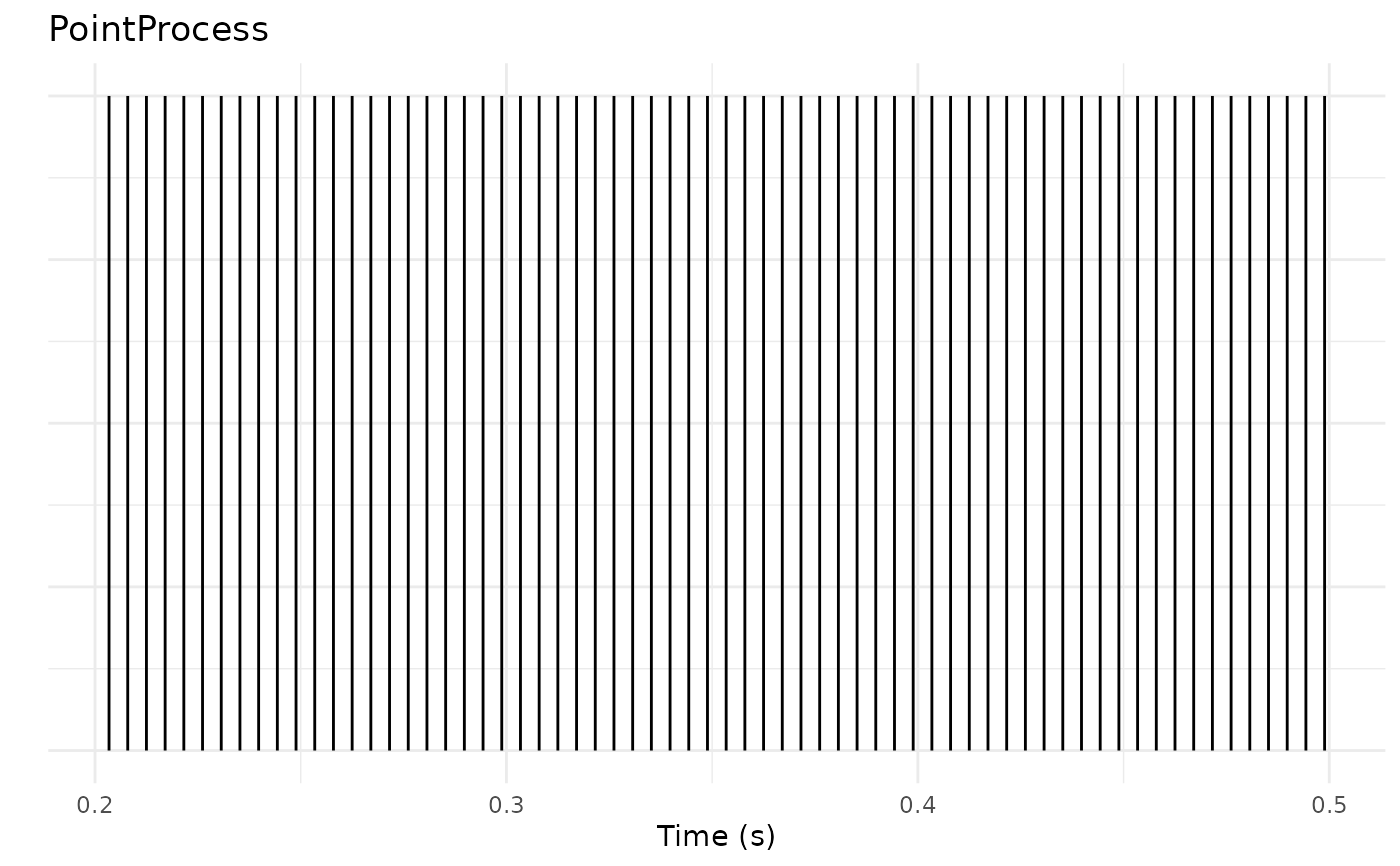
plot(pulses, from_time = 0.2, to_time = 0.5)
# Time range
plot(pulses, from_time = 0.2, to_time = 0.5)