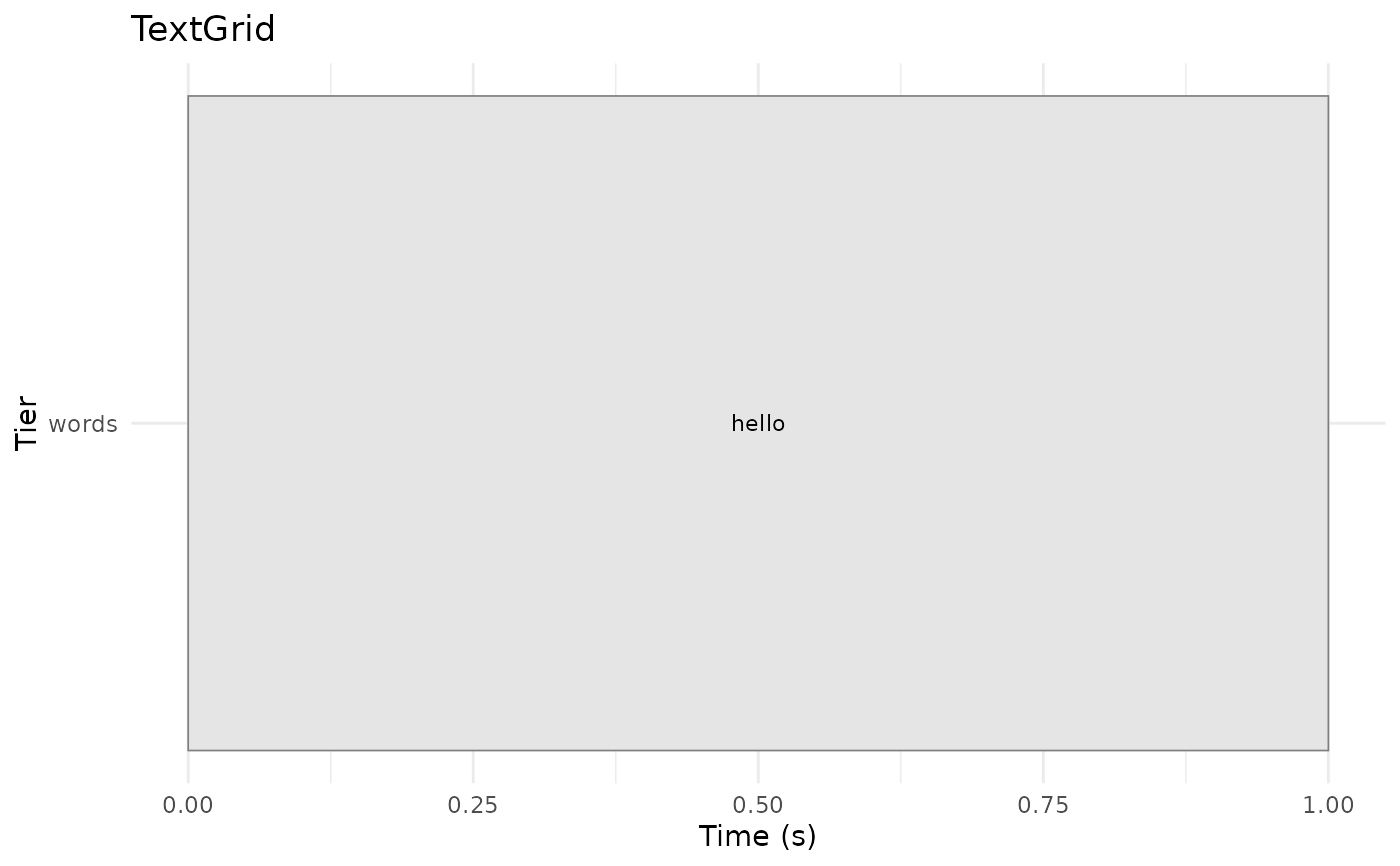
Visualize tier labels and boundaries as a standalone plot.
Usage
# S3 method for class 'TextGrid'
plot(x, tier = NULL, from_time = NULL, to_time = NULL, ...)Visualize tier labels and boundaries as a standalone plot.
# S3 method for class 'TextGrid'
plot(x, tier = NULL, from_time = NULL, to_time = NULL, ...)