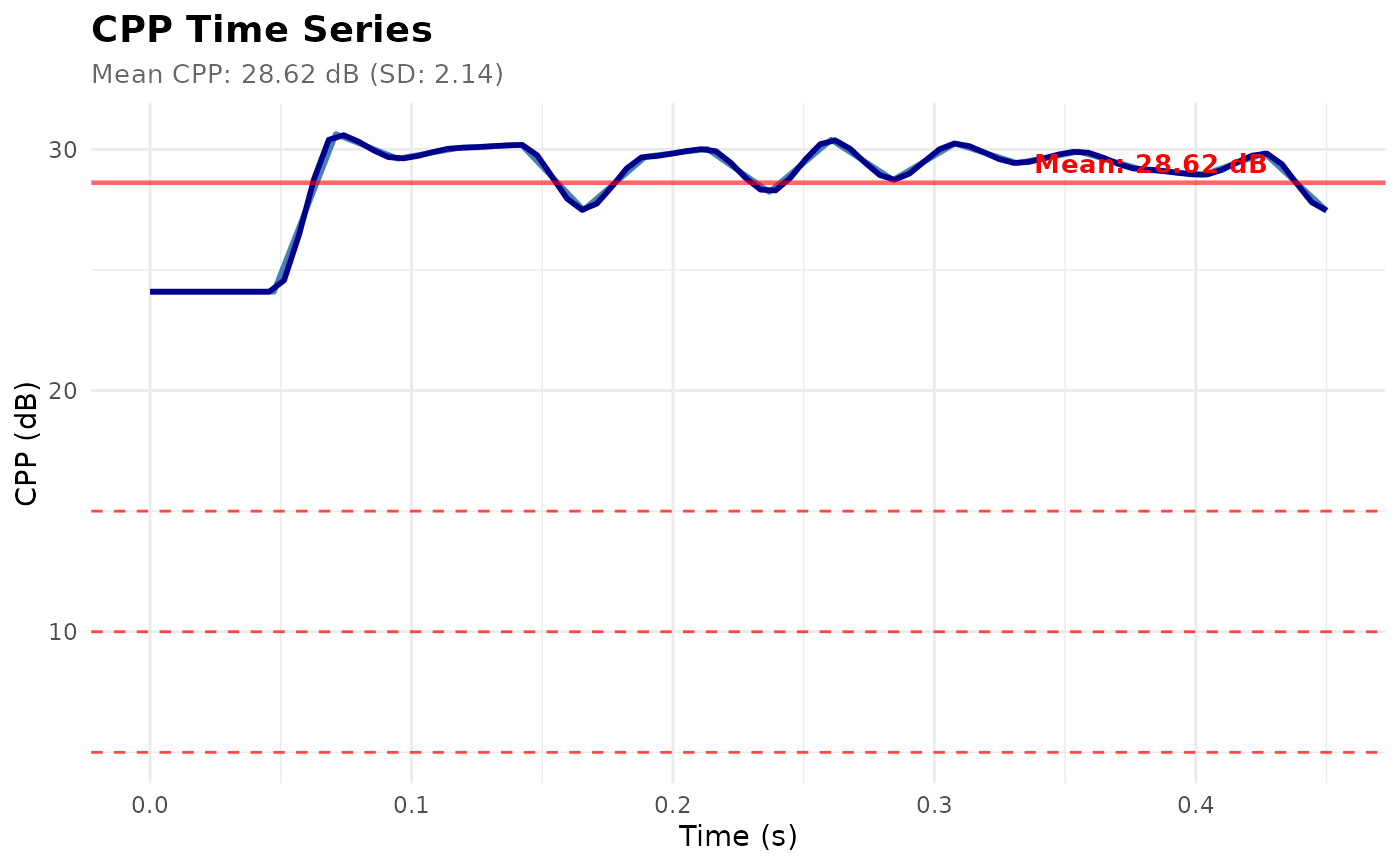
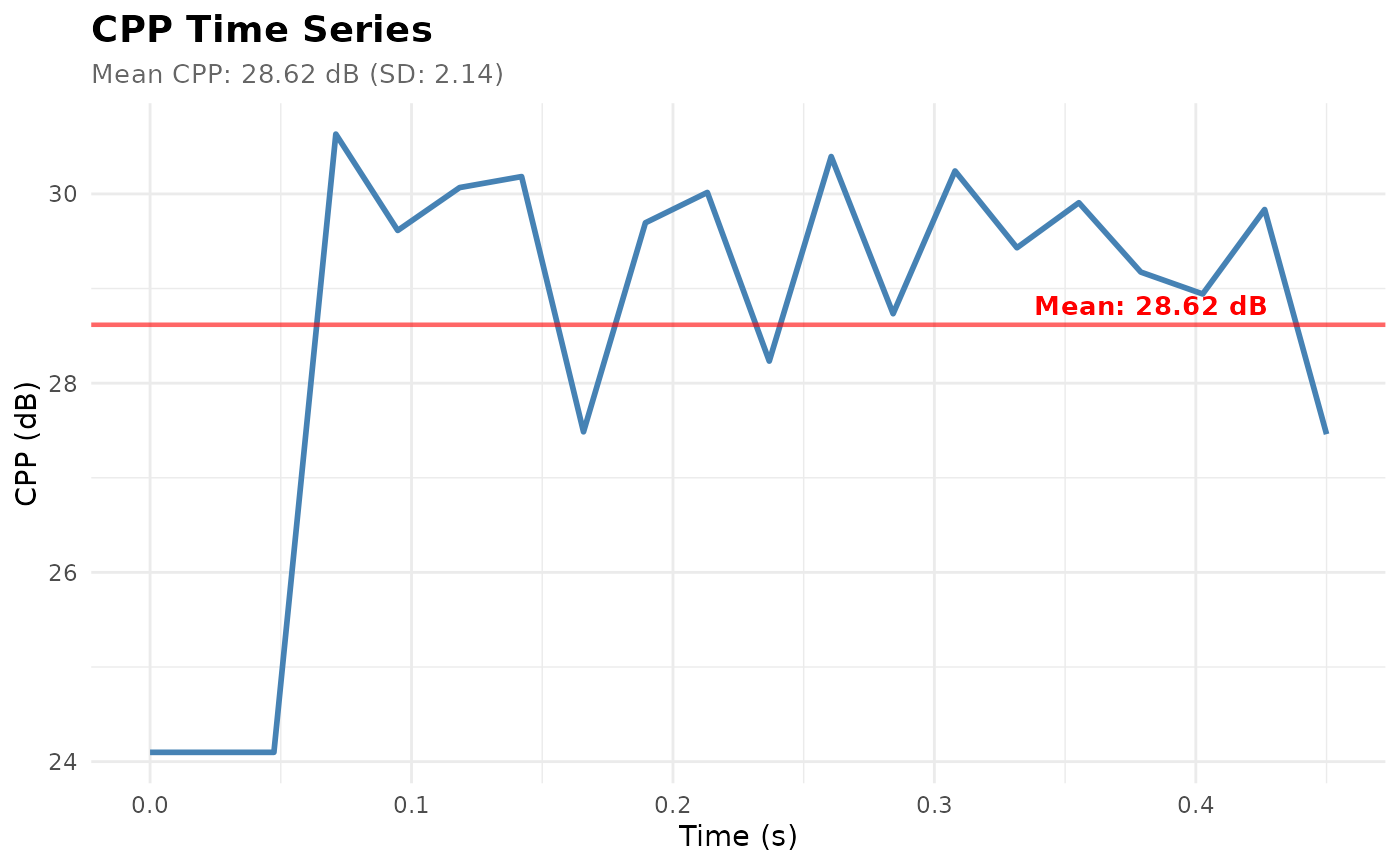
Creates a line plot of Cepstral Peak Prominence (CPP) values over time from a PowerCepstrogram object. Useful for tracking voice quality variation.
Usage
plot_cpp_timeseries(
  cepstrogram,
  time_range = NULL,
  qmin = 0.001,
  qmax = 0,
  n_samples = 100,
  smooth = FALSE,
  smooth_span = 0.1,
  reference_lines = NULL,
  title = NULL,
  theme = c("minimal", "bw", "classic")
)
Arguments
- cepstrogram
PowerCepstrogram object
- time_range
Numeric vector. c(start, end) time range to display (default: NULL = auto)
- qmin
Numeric. Minimum quefrency for peak search (default: 0.001)
- qmax
Numeric. Maximum quefrency for peak search (default: 0)
- n_samples
Integer. Number of time points to sample (default: 100)
- smooth
Logical. Apply smoothing to CPP contour (default: FALSE)
- smooth_span
Numeric. Smoothing span for loess (default: 0.1)
- reference_lines
Numeric vector. Reference CPP values to plot as horizontal lines (default: NULL)
- title
Character. Plot title (default: auto-generated)
- theme
Character. ggplot2 theme (default: "minimal")
Examples
sound <- Sound$create_tone(frequency = 220, duration = 0.5)
cepstrogram <- sound$to_powercepstrogram(pitch_floor = 60, time_step = 0.002)
# CPP time series
plot_cpp_timeseries(cepstrogram, n_samples = 20)
 # With smoothing and reference lines
plot_cpp_timeseries(cepstrogram,
n_samples = 20,
smooth = TRUE,
reference_lines = c(5, 10, 15))
#> `geom_smooth()` using formula = 'y ~ x'
#> Warning: span too small. fewer data values than degrees of freedom.
#> Warning: pseudoinverse used at -0.00225
#> Warning: neighborhood radius 0.025934
#> Warning: reciprocal condition number 0
#> Warning: There are other near singularities as well. 0.00067258
#> Warning: span too small. fewer data values than degrees of freedom.
#> Warning: pseudoinverse used at -0.00225
#> Warning: neighborhood radius 0.025934
#> Warning: reciprocal condition number 0
#> Warning: There are other near singularities as well. 0.00067258
#> Warning: no non-missing arguments to max; returning -Inf
# With smoothing and reference lines
plot_cpp_timeseries(cepstrogram,
n_samples = 20,
smooth = TRUE,
reference_lines = c(5, 10, 15))
#> `geom_smooth()` using formula = 'y ~ x'
#> Warning: span too small. fewer data values than degrees of freedom.
#> Warning: pseudoinverse used at -0.00225
#> Warning: neighborhood radius 0.025934
#> Warning: reciprocal condition number 0
#> Warning: There are other near singularities as well. 0.00067258
#> Warning: span too small. fewer data values than degrees of freedom.
#> Warning: pseudoinverse used at -0.00225
#> Warning: neighborhood radius 0.025934
#> Warning: reciprocal condition number 0
#> Warning: There are other near singularities as well. 0.00067258
#> Warning: no non-missing arguments to max; returning -Inf