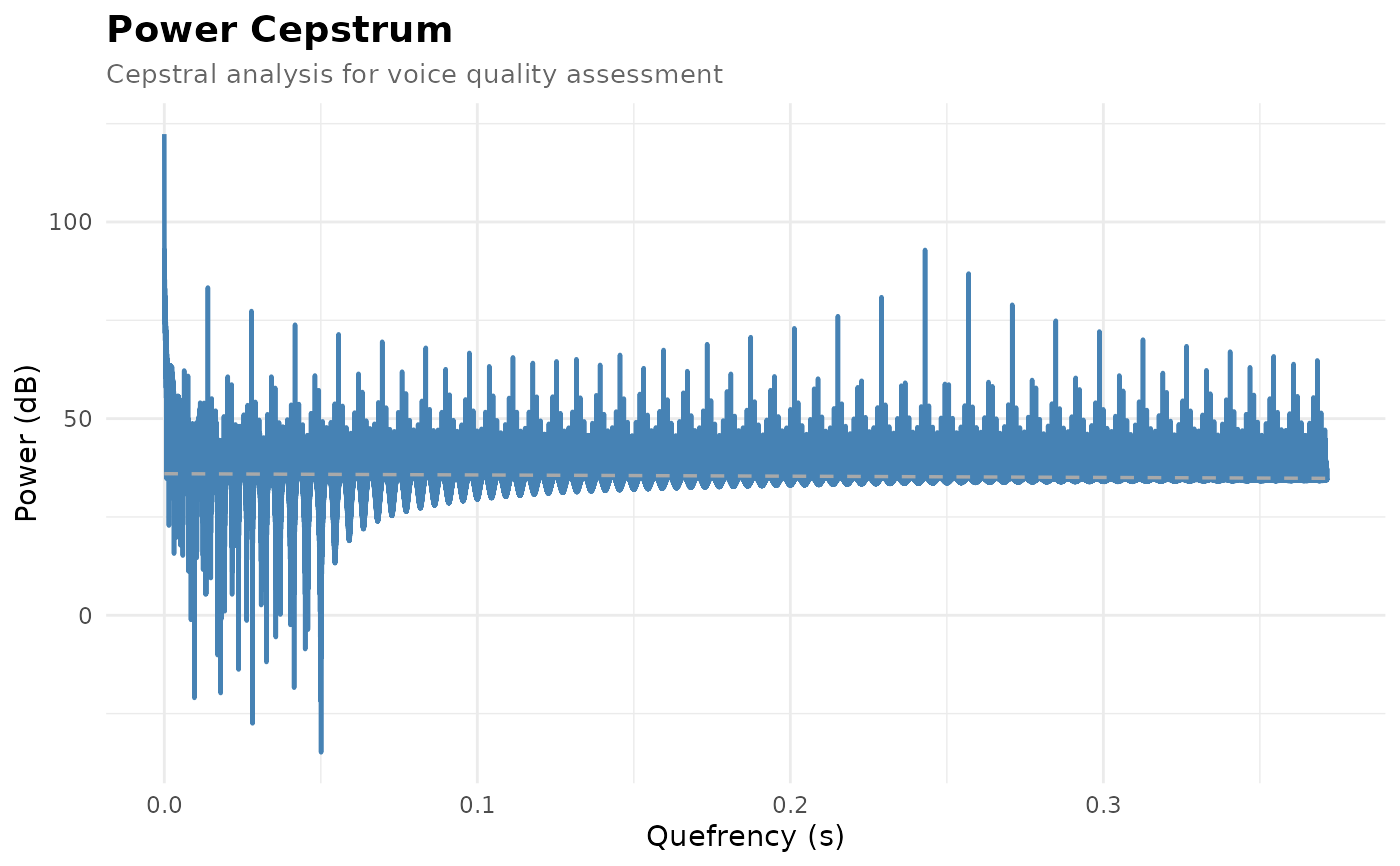
Creates a visualization of a power cepstrum showing the cepstral values across quefrencies, with optional peak and trend line annotations.
Arguments
- cepstrum
PowerCepstrum object
- show_peak
Logical. Highlight the cepstral peak (default: TRUE)
- show_trendline
Logical. Show regression trend line (default: TRUE)
- qmin
Numeric. Minimum quefrency for peak search (seconds, default: 0.001)
- qmax
Numeric. Maximum quefrency for peak search (seconds, default: 0)
- fit_method
Character. Trend line fit method (default: "straight")
- quefrency_range
Numeric vector. c(min, max) quefrency range to display (default: NULL = auto)
- db_range
Numeric vector. c(min, max) dB range to display (default: NULL = auto)
- title
Character. Plot title (default: auto-generated)
- theme
Character. ggplot2 theme: "minimal", "bw", "classic" (default: "minimal")
Examples
sound <- Sound$create_tone(frequency = 220, duration = 0.5)
spectrum <- sound$to_spectrum()
cepstrum <- spectrum$to_power_cepstrum()
# Basic plot
plot_powercepstrum(cepstrum)
#> Warning: Could not compute peak: unused arguments (qmin = 0.001, qmax = 0)
 # Customized plot
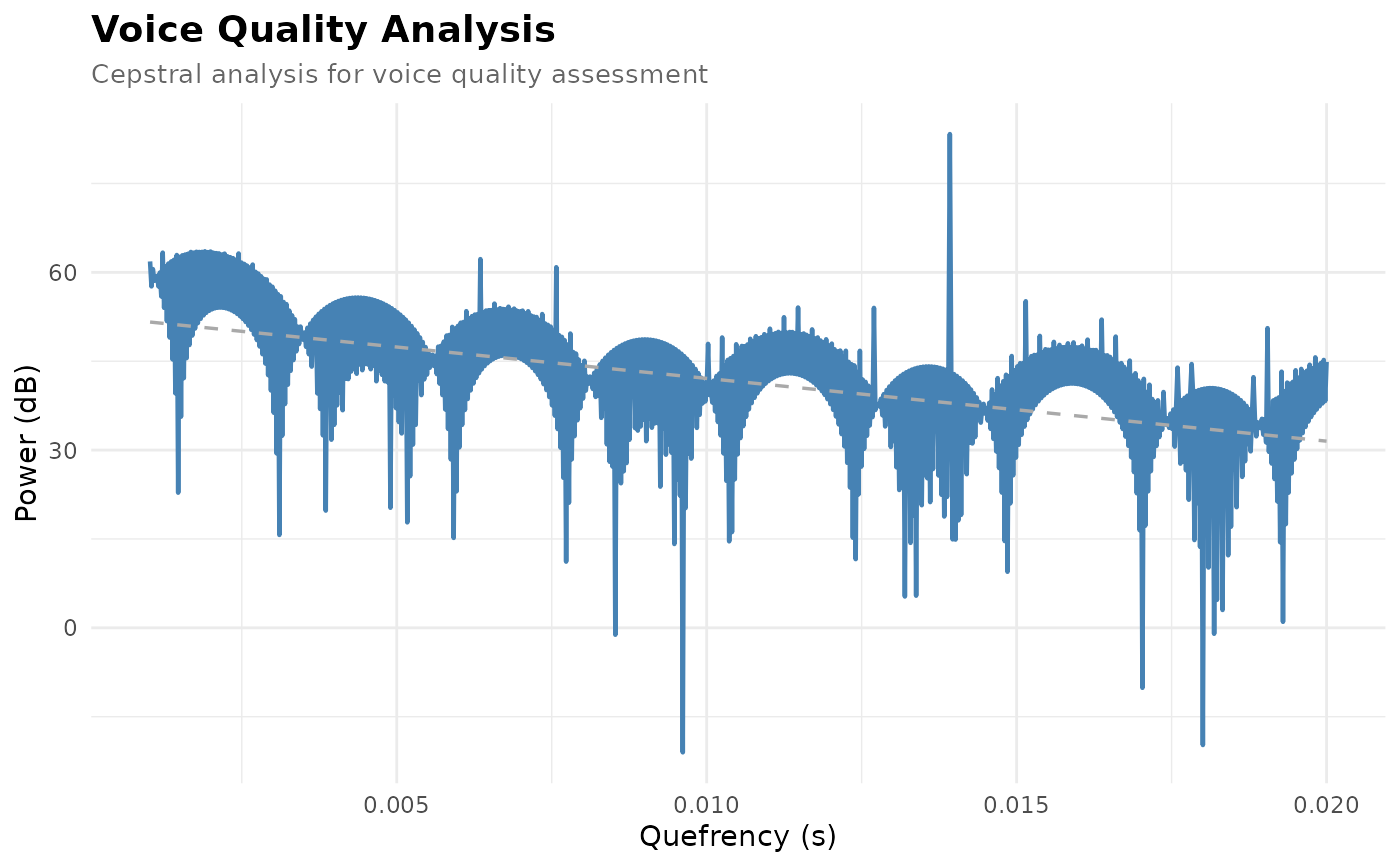
plot_powercepstrum(cepstrum,
show_peak = TRUE,
show_trendline = TRUE,
quefrency_range = c(0.001, 0.02),
title = "Voice Quality Analysis")
#> Warning: Could not compute peak: unused arguments (qmin = 0.001, qmax = 0)
# Customized plot
plot_powercepstrum(cepstrum,
show_peak = TRUE,
show_trendline = TRUE,
quefrency_range = c(0.001, 0.02),
title = "Voice Quality Analysis")
#> Warning: Could not compute peak: unused arguments (qmin = 0.001, qmax = 0)