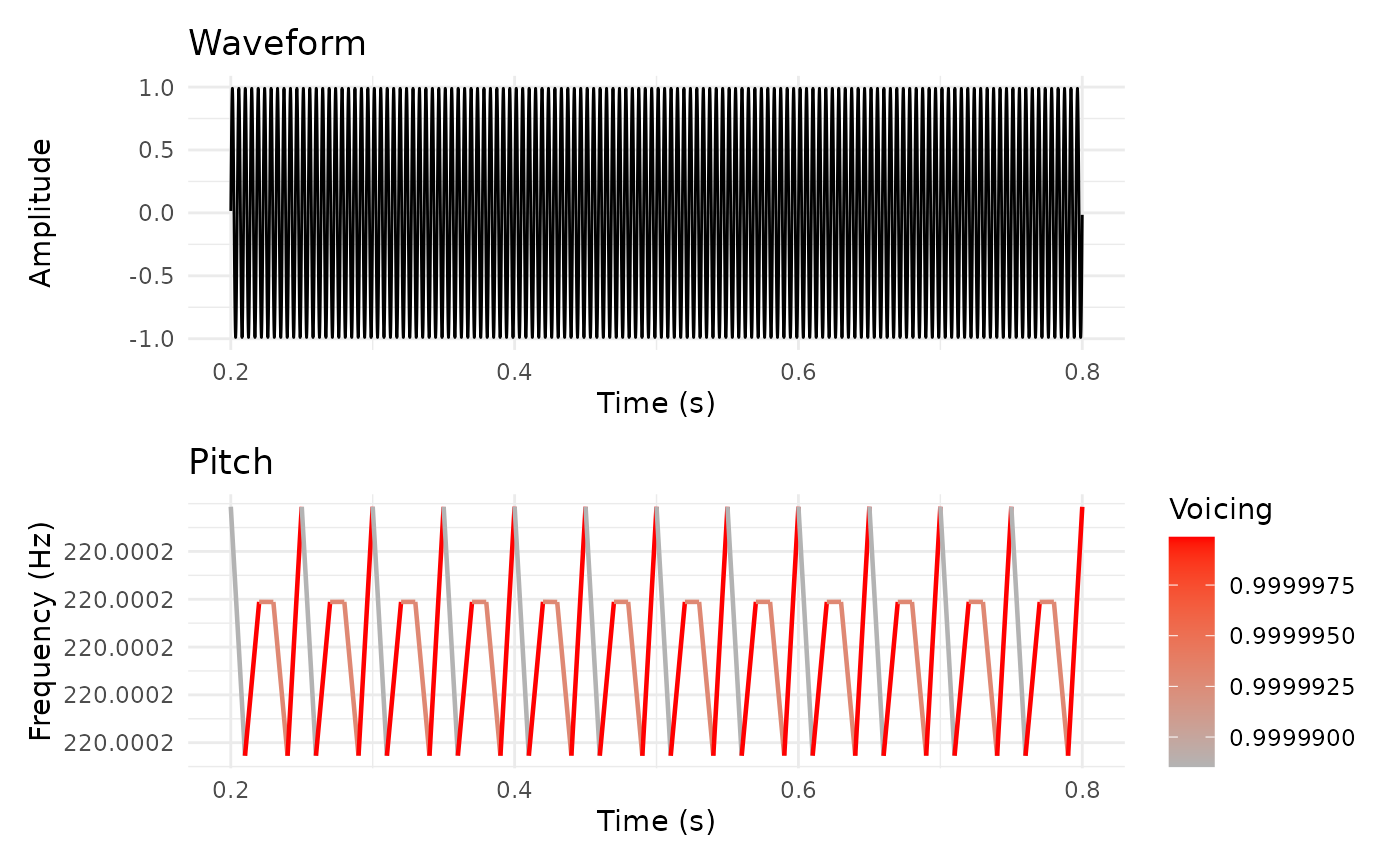
Creates a two-panel visualization showing the sound waveform in the top panel and pitch contour in the bottom panel, aligned by time. This is a common Praat visualization pattern.
Usage
plot_sound_pitch(
  sound,
  pitch,
  from_time = NULL,
  to_time = NULL,
  waveform_color = "steelblue",
  pitch_color = "darkblue",
  title = NULL,
  ...
)
Arguments
- sound
Sound object
- pitch
Pitch object
- from_time
Start time in seconds (NULL = from beginning)
- to_time
End time in seconds (NULL = to end)
- waveform_color
Character. Waveform color (default: "steelblue")
- pitch_color
Character. Pitch color (default: "darkblue")
- title
Character. Overall plot title (default: NULL)
- ...
Additional arguments passed to the underlying function or ignored.
Examples
if (requireNamespace("patchwork", quietly = TRUE) ||
    requireNamespace("gridExtra", quietly = TRUE)) {
  sound <- Sound$create_tone(frequency = 220, duration = 1.0)
  pitch <- sound$to_pitch()

  # Basic two-panel plot
  plot_sound_pitch(sound, pitch)

  # Time range and custom colors
  plot_sound_pitch(sound, pitch,
                  from_time = 0.2, to_time = 0.8,
                  waveform_color = "black",
                  pitch_color = "red")
}