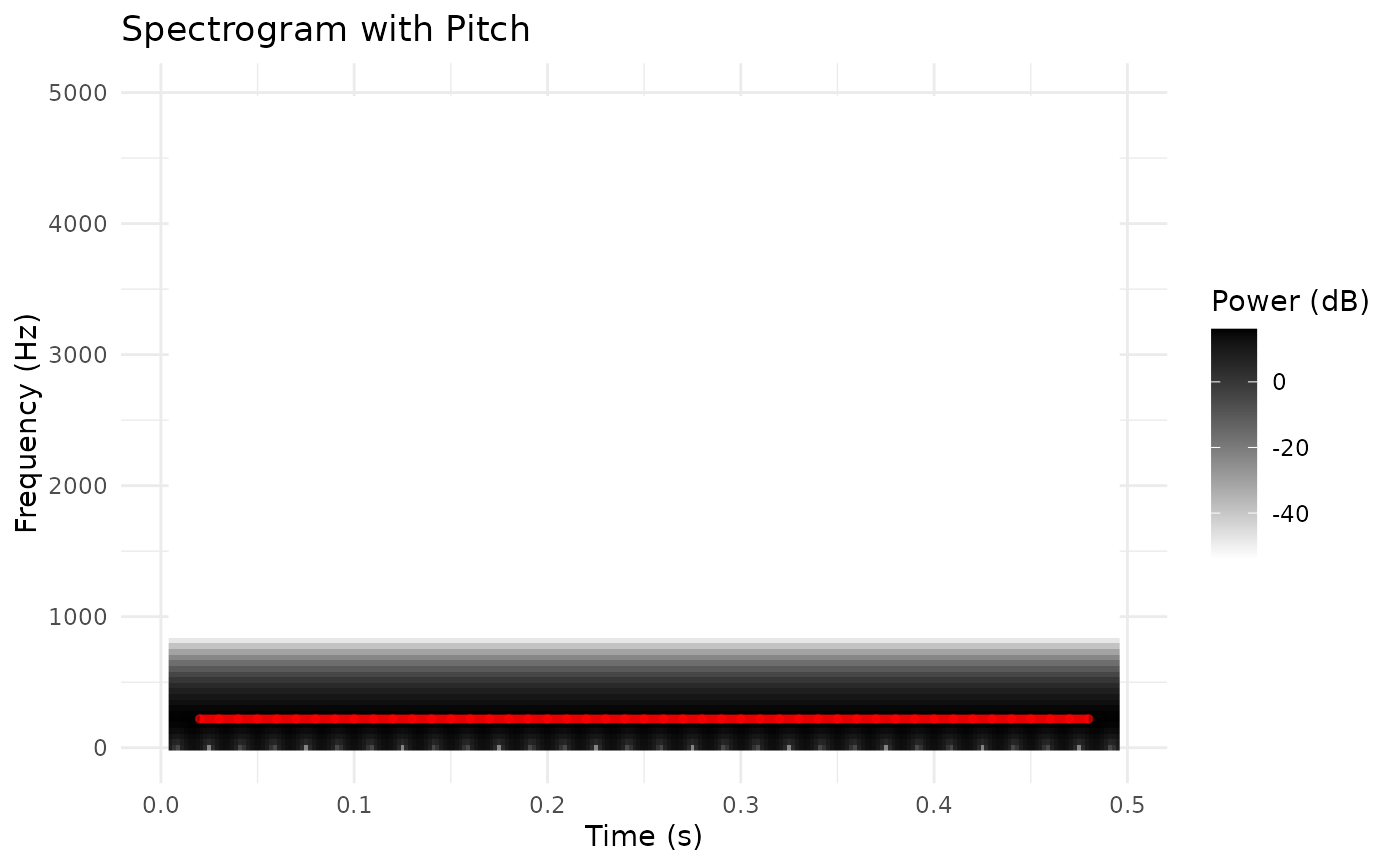
Creates a combined visualization showing a spectrogram with pitch contour overlaid. This is one of the most common Praat visualizations for voice analysis.
Usage
plot_spectrogram_pitch(
  spectrogram,
  pitch,
  from_time = NULL,
  to_time = NULL,
  freq_max = 5000,
  pitch_color = "blue",
  pitch_floor = NULL,
  pitch_ceiling = NULL,
  title = "Spectrogram with Pitch",
  ...
)
Arguments
- spectrogram
Spectrogram object
- pitch
Pitch object
- from_time
Start time in seconds (NULL = from beginning)
- to_time
End time in seconds (NULL = to end)
- freq_max
Maximum frequency to display in Hz (default: 5000)
- pitch_color
Character. Pitch track color (default: "blue")
- pitch_floor
Minimum F0 to display in Hz (default: NULL = auto)
- pitch_ceiling
Maximum F0 to display in Hz (default: NULL = auto)
- title
Character. Plot title (default: "Spectrogram with Pitch")
- ...
Additional arguments passed to plot methods
Examples
sound <- Sound$create_tone(frequency = 220, duration = 0.5)
spectrogram <- sound$to_spectrogram()
pitch <- sound$to_pitch()
# Basic combined plot
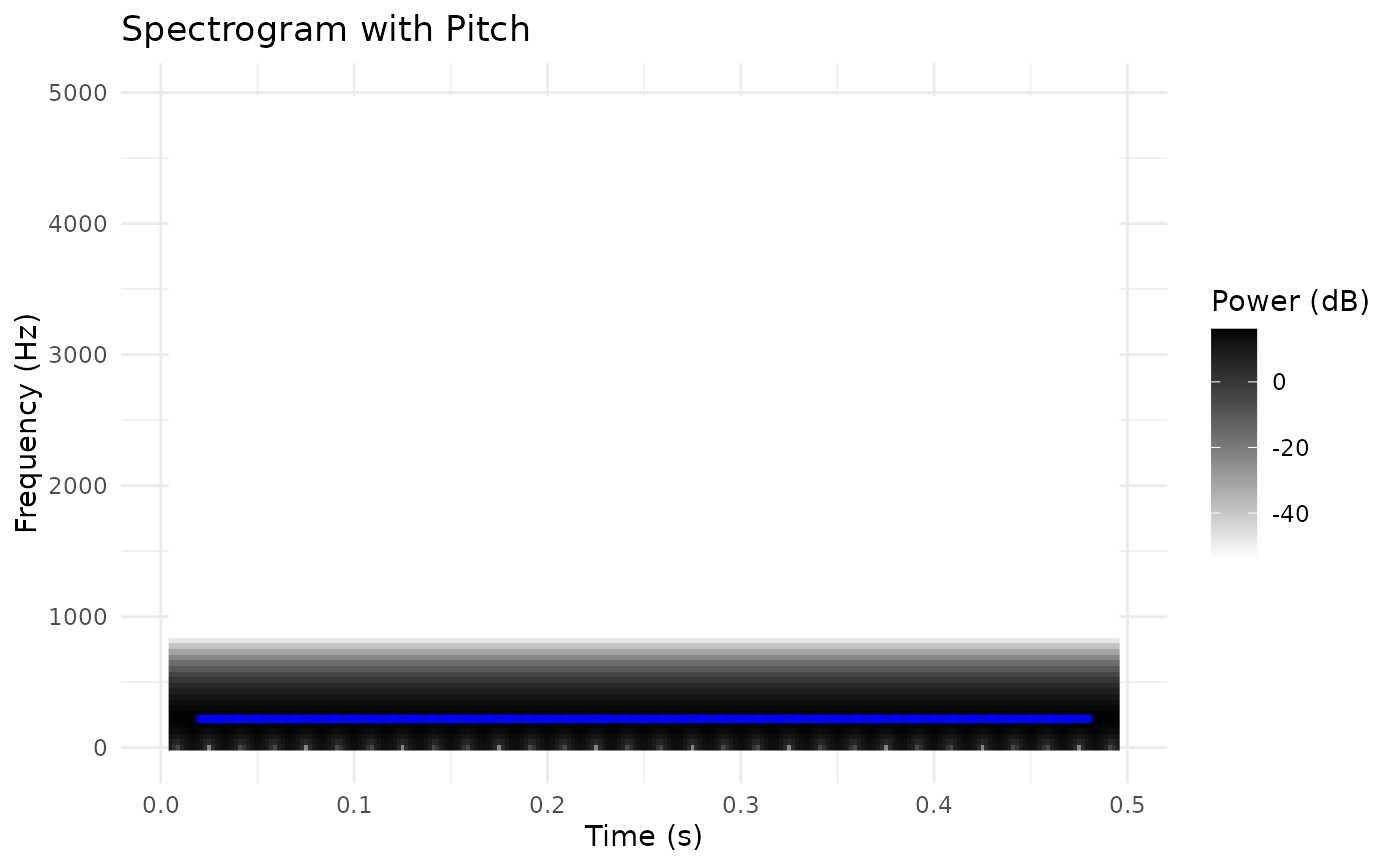
plot_spectrogram_pitch(spectrogram, pitch)
 # Customize pitch range
plot_spectrogram_pitch(spectrogram, pitch,
pitch_floor = 75, pitch_ceiling = 500,
pitch_color = "red")
# Customize pitch range
plot_spectrogram_pitch(spectrogram, pitch,
pitch_floor = 75, pitch_ceiling = 500,
pitch_color = "red")