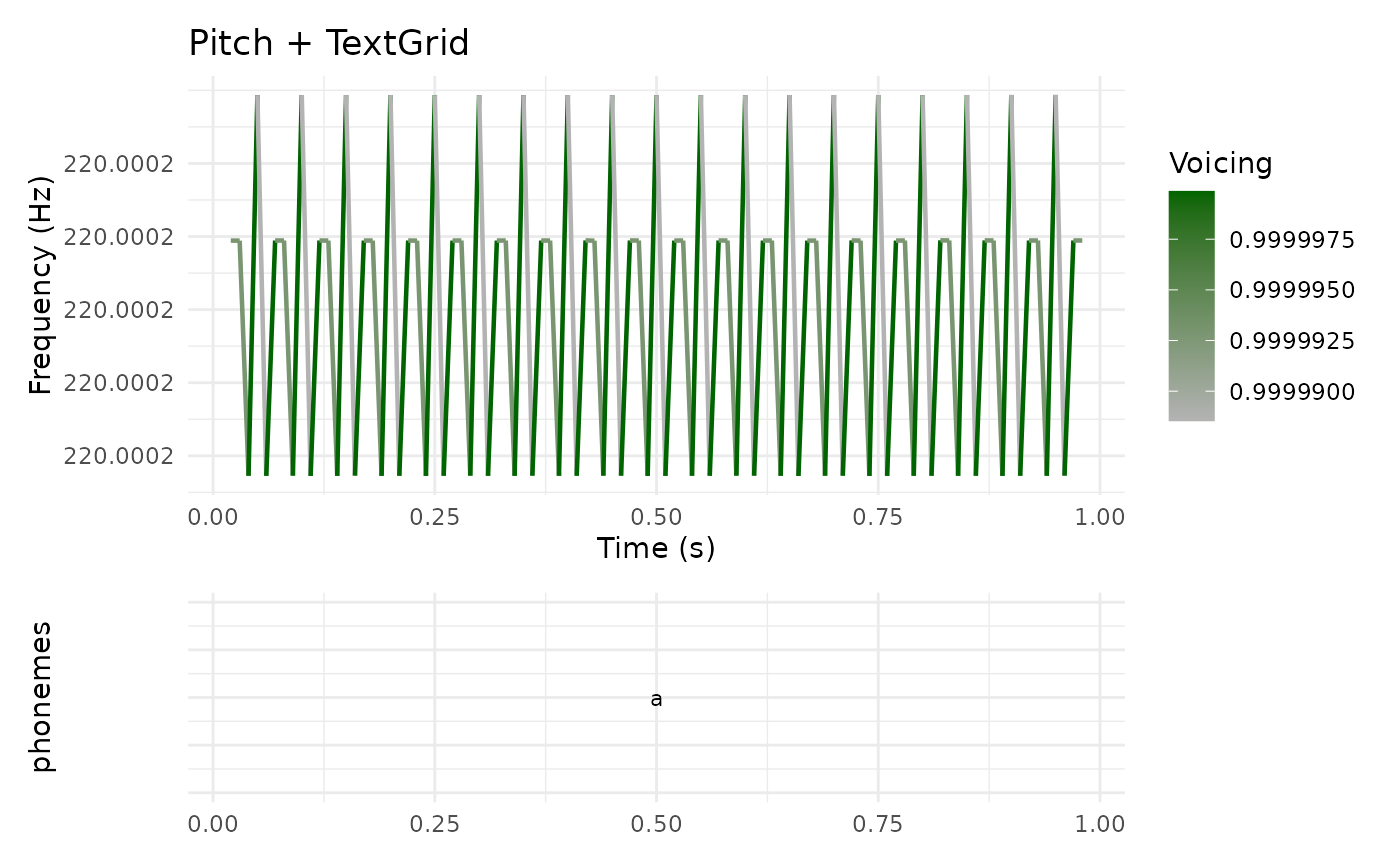
Creates a combined visualization showing a pitch contour with TextGrid annotation tiers. This replicates Praat's TextGrid_Pitch_draw() function.
Usage
plot_textgrid_pitch(
  textgrid,
  pitch,
  tier = NULL,
  from_time = NULL,
  to_time = NULL,
  pitch_color = "darkgreen",
  tier_colors = NULL,
  title = NULL,
  ...
)
Arguments
- textgrid
TextGrid object
- pitch
Pitch object
- tier
Integer or character. Tier number or name to display (default: all)
- from_time
Start time in seconds (NULL = from beginning)
- to_time
End time in seconds (NULL = to end)
- pitch_color
Character. Pitch line color (default: "darkgreen")
- tier_colors
Character vector. Colors for each tier (default: auto)
- title
Character. Plot title (default: NULL)
- ...
Additional arguments passed to plot methods
Examples
if (requireNamespace("patchwork", quietly = TRUE) ||
    requireNamespace("gridExtra", quietly = TRUE)) {
  sound <- Sound$create_tone(frequency = 220, duration = 1.0)
  pitch <- sound$to_pitch()
  textgrid <- TextGrid$create(0, 1, "phonemes")
  textgrid$set_interval_text("phonemes", 1, "a")

  # Combined pitch + TextGrid
  plot_textgrid_pitch(textgrid, pitch)

  # Single tier
  plot_textgrid_pitch(textgrid, pitch, tier = "phonemes")
}